RollL
Use the table showing Manuel's and Gretchen's data to determine the mean, median, standa...

Mathematics, 20.04.2020 17:20 kimhoss2
RollL
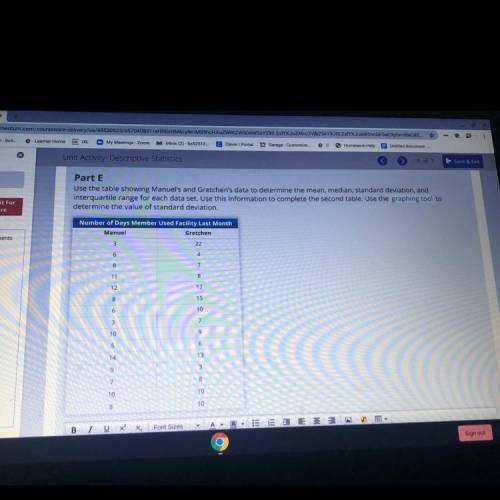
Use the table showing Manuel's and Gretchen's data to determine the mean, median, standard deviation, and
interquartile range for each data set. Use this information to complete the second table. Use the graphing tool to
determine the value of standard deviation.
Number of Days Member Used Facility Last Month
Manuel
Gretchen

Answers: 3


Other questions on the subject: Mathematics
Mathematics, 21.06.2019 16:00, laylay4527
One card is dealt from a 52 card deck. find the probability that the dealt card is a 4 or a black 7
Answers: 2
Mathematics, 21.06.2019 19:30, Jenan25
Consider this equation. |y + 6| = 2 what can be concluded of the equation? check all that apply. there will be one solution. there will be two solutions. the solution to –(y + 6) = 2 will be also be a solution to the given absolute value equation. the solution(s) will be the number(s) on the number line 2 units away from –6. the value of y must be positive since the variable is inside absolute value signs.
Answers: 1
You know the right answer?
Questions in other subjects:


