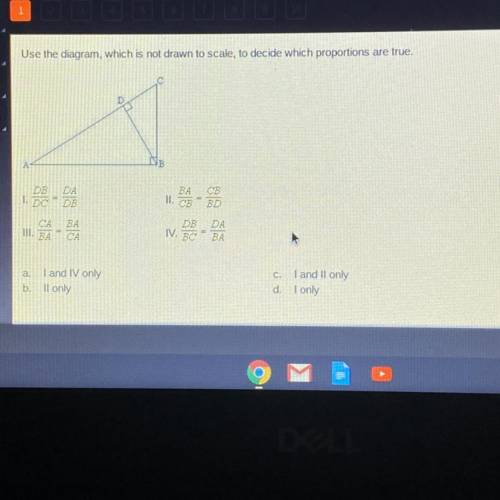
Use the diagram, which is not drawn to scale, to decide which proportions are true.
...

Mathematics, 19.04.2020 22:45 MadDaddy95
Use the diagram, which is not drawn to scale, to decide which proportions are true.

Answers: 1


Other questions on the subject: Mathematics
Mathematics, 21.06.2019 22:20, skyhighozzie
(b) suppose that consolidated power decides to use a level of significance of α = .05, and suppose a random sample of 100 temperature readings is obtained. if the sample mean of the 100 temperature readings is x⎯⎯ = 60.990, test h0 versus ha and determine whether the power plant should be shut down and the cooling system repaired. perform the hypothesis test by using a critical value and a p-value. assume σ = 5. (round your z to 2 decimal places and p-value to 4 decimal places.)
Answers: 2
Mathematics, 22.06.2019 07:40, saucyboyFredo
Camille is preparing for her english test by typing up the notes she recorded in the margins of her 98-page workbook. she already started typing her notes, and got through the first 14 pages. if camille types for x hours at a rate of 21 pages per hour, which equation represents the number of pages she has typed, and how many hours will it take to complete the task?
Answers: 3
Mathematics, 22.06.2019 08:00, johnkings140
Which is the graph of f(x) = 0.5(4)x? the population of a town grows exponentially. after 1 year, the population is 34,560. after 2 years, the population is 37,325. which equation can be used to predict, y, the number of people living in the town after x years? (round population values to the nearest whole number.)
Answers: 3
You know the right answer?
Questions in other subjects:
Mathematics, 03.08.2019 09:30

Mathematics, 03.08.2019 09:30

Mathematics, 03.08.2019 09:30

Mathematics, 03.08.2019 09:30
Mathematics, 03.08.2019 09:30

Social Studies, 03.08.2019 09:30


