
Mathematics, 28.09.2019 20:30 goeringwilliam6974
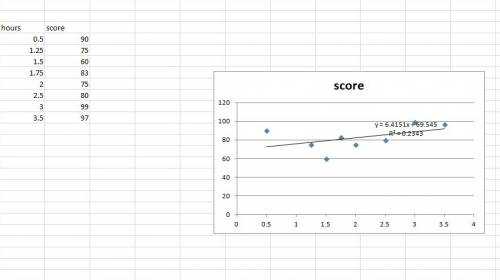
Use a graphing calculator to determine which equation for the line of regression, pearson product-moment correlation value (r), and predicted value match the data in the chart. the chart below shows the number of hours a student spent studying for a math test and the score the student earned on the test. hours spent studying | 0.5|1.25| 1.5 |1.75 |2 | 2.5 |3 |3.5 |4 |
test | 90 | 75| 60 | 83 |75| 80| 99| 97| ? |
a) y = 6.4x + 69.5, r = 0.48
predicted test score for 4 hours of study equals 95.
b) y = 6.1x + 74.5, r = 0.48
predicted test score for 4 hours of study equals 99.
c) y = 5.1x + 74.5, r = 0.88
predicted test score for 4 hours of study equals 95.
d) y = 7.4x + 69.5, r = 0.88
predicted test score for 4 hours of study equals 99.

Answers: 1


Other questions on the subject: Mathematics
Mathematics, 21.06.2019 16:00, kell22wolf
Part one: measurements 1. measure your own height and arm span (from finger-tip to finger-tip) in inches. you will likely need some from a parent, guardian, or sibling to get accurate measurements. record your measurements on the "data record" document. use the "data record" to you complete part two of this project. name relationship to student x height in inches y arm span in inches archie dad 72 72 ginelle mom 65 66 sarah sister 64 65 meleah sister 66 3/4 67 rachel sister 53 1/2 53 emily auntie 66 1/2 66 hannah myself 66 1/2 69 part two: representation of data with plots 1. using graphing software of your choice, create a scatter plot of your data. predict the line of best fit, and sketch it on your graph. part three: the line of best fit include your scatter plot and the answers to the following questions in your word processing document 1. 1. which variable did you plot on the x-axis, and which variable did you plot on the y-axis? explain why you assigned the variables in that way. 2. write the equation of the line of best fit using the slope-intercept formula $y = mx + b$. show all your work, including the points used to determine the slope and how the equation was determined. 3. what does the slope of the line represent within the context of your graph? what does the y-intercept represent? 5. use the line of best fit to you to describe the data correlation.
Answers: 2
Mathematics, 21.06.2019 20:00, brunovillarreal6576
Find the slope of the line passing through a pair of points
Answers: 2
Mathematics, 21.06.2019 20:30, GreenHerbz206
Tom is the deli manager at a grocery store. he needs to schedule employee to staff the deli department for no more that 260 person-hours per week. tom has one part-time employee who works 20 person-hours per week. each full-time employee works 40 person-hours per week. write and inequality to determine n, the number of full-time employees tom may schedule, so that his employees work on more than 260 person-hours per week. graph the solution set to this inequality.
Answers: 1
You know the right answer?
Use a graphing calculator to determine which equation for the line of regression, pearson product-mo...
Questions in other subjects:
Mathematics, 17.03.2020 04:33

History, 17.03.2020 04:33
History, 17.03.2020 04:33
Mathematics, 17.03.2020 04:33

Computers and Technology, 17.03.2020 04:33


