Me!
dylan created color panels for a wall using a mix of only green and blue paints. he plott...

Mathematics, 20.09.2019 18:00 queenjay34
Me!
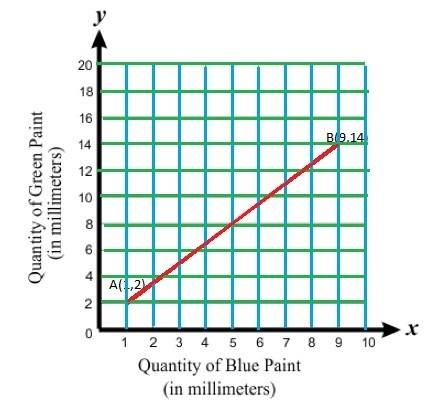
dylan created color panels for a wall using a mix of only green and blue paints. he plotted the quantities of blue and green paints used for each mix and connected them using a line segment, as shown in the graph below:
line graph color mix, quantity of blue paint, in mm, the x axis and quantity of green paint, in mm, the y axis. x axis has a scale from 0 to 10 increments of 1. y axis has a scale of 0 to 20 increments of 2. straight line 1, 2 and 9, 14 is drawn
which statement best describes the domain of the function represented in the graph?
0 ≤ x ≤ 9 or x is between 0 and 9, inclusive
2 ≤ x ≤ 14 or x is between 2 and 14, inclusive
1 ≤ x ≤ 9 or x is between 1 and 9, inclusive
1 ≤ x ≤ 14 or x is between 1 and 14, inclusive

Answers: 2


Other questions on the subject: Mathematics

Mathematics, 21.06.2019 18:30, latinotimo7643
Use the four functions below for this question. compare and contrast these four functions using complete sentences focus on the slope and y- intercept first, and then on any additional properties of each function
Answers: 3

Mathematics, 21.06.2019 19:30, estherstlouis7812
1. find the area of the unshaded square 2. find the area of the large square 3. what is the area of the frame represented by the shaded region show
Answers: 1

Mathematics, 21.06.2019 22:00, leomcintyre12
If you have 12 feet of string and you cut it into equal length of 5 inches each how much string will be left
Answers: 2
You know the right answer?
Questions in other subjects:


Mathematics, 20.08.2021 03:10


Mathematics, 20.08.2021 03:10

Mathematics, 20.08.2021 03:10


Biology, 20.08.2021 03:10


