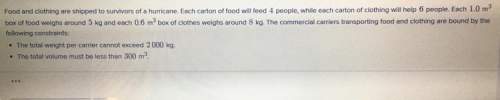
Enter values for x and y in the table to plot points in the
graph
Enter the t shirt pric...

Mathematics, 17.04.2020 20:19 andrea732
Enter values for x and y in the table to plot points in the
graph
Enter the t shirt price and sales data Sera collected
into the regression calculator and generate a
regression line
Price (8): x
*Sold: y
10
26
12
22
14
17
16 17
128
The regression line shows a
The relationship between the price of a t shirt and the
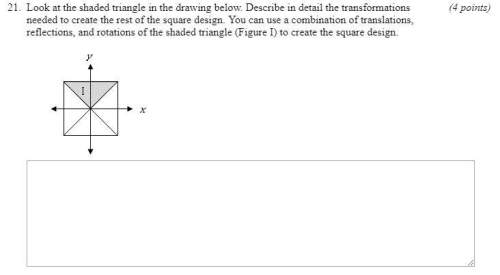
number of t shirts sold is

Answers: 3


Other questions on the subject: Mathematics
Mathematics, 21.06.2019 19:00, Brendah4962
Solve the equation using the zero-product property. -3n(7n - 5) = 0 a. 0, -5/7 b. -1/3, -5/7 c. -1/3, 5/7 d. 0, 5/7
Answers: 2
Mathematics, 22.06.2019 02:30, Hippiekoolaid
How much is $1200 worth at the end of1 year, if the interest rate is 5.5% is compounded quarterly.
Answers: 1
Mathematics, 22.06.2019 04:30, Teilen
Cesar bought 7 items at the candy store. he bought candy bars for $0.50 each and packs of gum for $0.95 each. he spent a total of $6.80. what system represents the solution for the number of candy bars (x) and the number of pack gum (y) purchased?
Answers: 1
You know the right answer?
Questions in other subjects:
Mathematics, 05.02.2021 18:30

Social Studies, 05.02.2021 18:30
Mathematics, 05.02.2021 18:30

Computers and Technology, 05.02.2021 18:30
Mathematics, 05.02.2021 18:30

Physics, 05.02.2021 18:30
Mathematics, 05.02.2021 18:30
Mathematics, 05.02.2021 18:30

History, 05.02.2021 18:30

Biology, 05.02.2021 18:30


