
Mathematics, 17.04.2020 20:00 july00
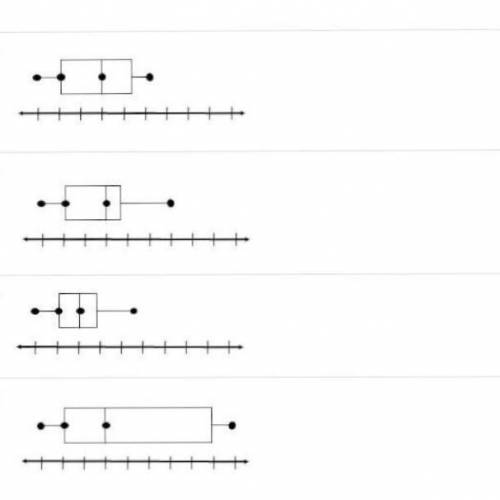
Please help! Which box plot represents a set of data that has the greatest mean absolute deviation? (see attached image)

Answers: 2


Other questions on the subject: Mathematics
Mathematics, 21.06.2019 20:30, kcarstensen59070
Solve each quadratic equation by factoring and using the zero product property. 10x + 6 = -2x^2 -2
Answers: 2
Mathematics, 21.06.2019 22:10, 666isabella666
Gravel is being dumped from a conveyor belt at a rate of 25 ft3/min, and its coarseness is such that it forms a pile in the shape of a cone whose base diameter and height are always equal. how fast is the height of the pile increasing when the pile is 14 ft high? (round your answer to two decimal places.) ft/min
Answers: 3
Mathematics, 22.06.2019 02:30, familyk0jj3
Graph the function =gx+2x3 and give its domain and range using interval notation.
Answers: 3
You know the right answer?
Please help! Which box plot represents a set of data that has the greatest mean absolute deviation?...
Questions in other subjects:


Mathematics, 15.12.2020 22:00

Mathematics, 15.12.2020 22:00
Biology, 15.12.2020 22:00
Mathematics, 15.12.2020 22:00
History, 15.12.2020 22:00


