
Mathematics, 17.04.2020 18:47 devenairefp85xfg
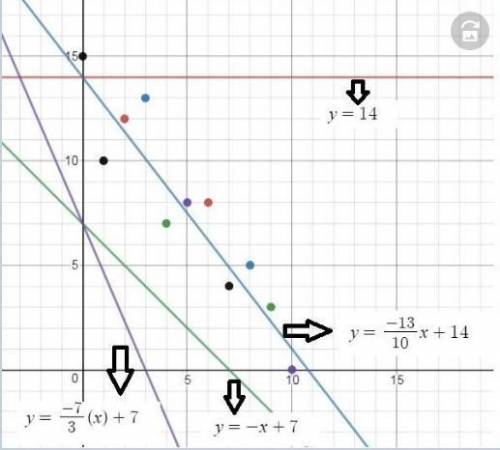
BRAINLIEST PLZ HELP A scatter plot with a line is shown below. Graph shows numbers from 0 to 10 at increments of 1 on the x axis and numbers from 0 to 15 at increments of 1 on the y axis. Scatter plot shows ordered pairs 0, 1 and 1, 2 and 2, 3 and 3,4 and 4, 4 and 5, 6 and 6, 8 and 7, 8 and 8, 11 and 9, 13 and 10, 15. A line joins ordered pairs 0, 0 and 10, 13.6. Which statement is most likely correct about the line? It can be the line of best fit because it is closest to most data points. It can be the line of best fit because it passes through all the scatter points. It cannot be the line of best fit because it does not pass through all the points. It cannot be the line of best fit because it does not pass through the first and last points

Answers: 2


Other questions on the subject: Mathematics
Mathematics, 21.06.2019 18:40, elleinad5656
What dimensions can créate more than one triangle ?
Answers: 1
Mathematics, 22.06.2019 01:30, treestump090
Fill in the missing exponents in each box and show how you found the answer. (4 points: 2 points for each correct answer with work shown) c. (9^4)^? =9^1 d.(5^? )^3=5^1 *question marks represent the boxes
Answers: 3
Mathematics, 22.06.2019 02:00, mathhelppls14
1. the manager of collins import autos believes the number of cars sold in a day (q) depends on two factors: (1) the number of hours the dealership is open (h) and (2) the number of salespersons working that day (s). after collecting data for two months (53 days), the manager estimates the following log-linear model: q 4 equation 1 a. explain, how to transform the log-linear model into linear form that can be estimated using multiple regression analysis. the computer output for the multiple regression analysis is shown below: q4 table b. how do you interpret coefficients b and c? if the dealership increases the number of salespersons by 20%, what will be the percentage increase in daily sales? c. test the overall model for statistical significance at the 5% significance level. d. what percent of the total variation in daily auto sales is explained by this equation? what could you suggest to increase this percentage? e. test the intercept for statistical significance at the 5% level of significance. if h and s both equal 0, are sales expected to be 0? explain why or why not? f. test the estimated coefficient b for statistical significance. if the dealership decreases its hours of operation by 10%, what is the expected impact on daily sales?
Answers: 2
You know the right answer?
BRAINLIEST PLZ HELP A scatter plot with a line is shown below. Graph shows numbers from 0 to 10 at i...
Questions in other subjects:


Geography, 08.12.2020 22:30
Mathematics, 08.12.2020 22:30
Mathematics, 08.12.2020 22:30
Mathematics, 08.12.2020 22:30
Mathematics, 08.12.2020 22:30

History, 08.12.2020 22:30
History, 08.12.2020 22:30


