HELP NOW PLZ!
Which is true about the data shown in the scatter plot?
A) The data have n...

Mathematics, 16.04.2020 02:23 niniaalvarez
HELP NOW PLZ!
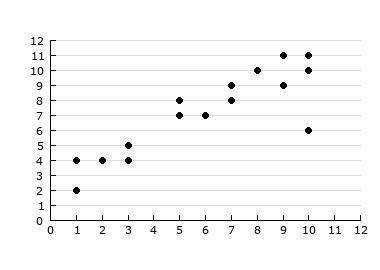
Which is true about the data shown in the scatter plot?
A) The data have no clusters and outliers.
B) The data cluster along a line and there is no outlier.
C) The data cluster along a curve and there is no outlier.
D) The data cluster along a line. The point (10, 6) is an outlier.

Answers: 1


Other questions on the subject: Mathematics
Mathematics, 21.06.2019 22:40, btaylor1179
Awoman has 14 different shirts: 10 white shirts and 4 red shirts. if she randomly chooses 2 shirts to take with her on vacation, then what is the probability that she will choose two white shirts? show your answer in fraction and percent, round to the nearest whole percent.
Answers: 3
Mathematics, 21.06.2019 23:00, ronaldotheexplorer12
The ratio of the perimeters of two similar triangles is 4: 3. what are the areas of these triangles if the sum of their areas is 130cm2?
Answers: 3
You know the right answer?
Questions in other subjects:
Mathematics, 25.01.2022 01:00
Mathematics, 25.01.2022 01:00


History, 25.01.2022 01:00


