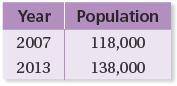
The table shows population data for a community.
a. To the nearest hundredth of a percent, wha...

Mathematics, 16.04.2020 00:00 happy121906
The table shows population data for a community.
a. To the nearest hundredth of a percent, what is the percent of change from 2007 to 2013? (This is 16.95%)
b. Use this percent of change to predict the population in 2019.

Answers: 2


Other questions on the subject: Mathematics
Mathematics, 21.06.2019 13:50, talahtoo6659
Is every rectangle is a parallelogram? true false
Answers: 2
Mathematics, 21.06.2019 15:00, kayleenfifep3hgi4
Pete is making decorations for a dinner party. the instructions tell him to use 9 flowers for a medium-sized decoration. complete each statement to adjust the flowers for different-sized decorations based on these instructions.
Answers: 2
Mathematics, 21.06.2019 16:10, GgRed
Abox contains 1 plain pencil and 4 pens. a second box contains 5 color pencils and 5 crayons. one item from each box is chosen at random. what is the probability that a plain pencil from the first box and a color pencil from the second box are selected? write your answer as a fraction in simplest form.
Answers: 1
Mathematics, 21.06.2019 18:30, anabellabenzaquen
The volume of a sphere is increased by 6%. calculate the corresponding percentage increased in it area.
Answers: 3
You know the right answer?
Questions in other subjects:


Business, 07.11.2020 16:40
Mathematics, 07.11.2020 16:40

English, 07.11.2020 16:40

English, 07.11.2020 16:40


