
Mathematics, 15.04.2020 23:44 alexsandra120505
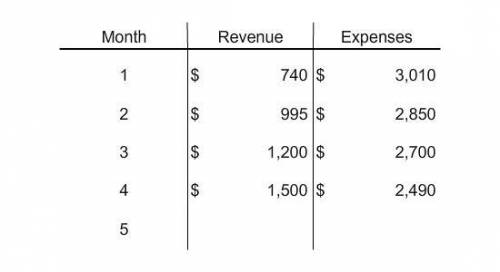
Graph the information presented in the table. Use that graph to predict the week that revenue will equal expenses for this small company.
Note: Revenue and Expenses are drawn on the vertical axis and Month is on the horizontal axis.

Answers: 1


Other questions on the subject: Mathematics
Mathematics, 21.06.2019 17:00, uuuugggghhhh2463
At the beginning of the day, stock xyz opened at $6.12. at the end of the day, it closed at $6.88. what is the rate of change of stock xyz? a. 1.17% b. 11.0% c. 12.4% d. 81.5%
Answers: 1
Mathematics, 21.06.2019 20:30, raquelqueengucci25
Evaluate 8j -k+148j−k+14 when j=0.25j=0.25 and k=1k=1.
Answers: 1
Mathematics, 22.06.2019 01:00, hlannette7005
Triangles abd and ace are similar right triangles. witch ratio best explains why the slope of ab is the same as the slope of ac?
Answers: 2
You know the right answer?
Graph the information presented in the table. Use that graph to predict the week that revenue will e...
Questions in other subjects:

Mathematics, 18.09.2019 20:00
History, 18.09.2019 20:00
Mathematics, 18.09.2019 20:00


Mathematics, 18.09.2019 20:00


