
Mathematics, 15.04.2020 17:42 mojio22
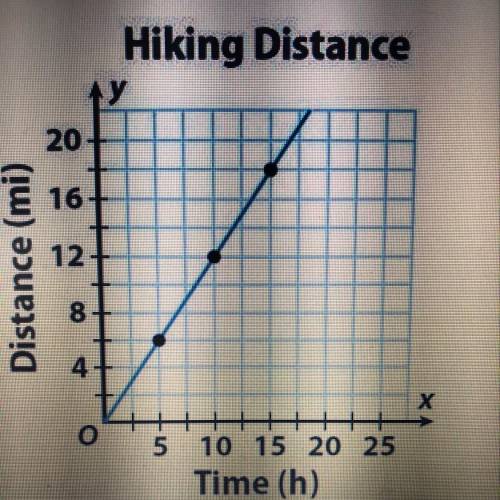
Jacob is planning a hiking trip for this spring. The graph shows the relationship between time and distance for the hike.
Based on this information, which is the independent variable and the dependent variable?
A)Both time and distance are dependent variables.
B)Both time and distance are independent variables.
C)The independent variable is time, and the dependent variable is distance.
D)The dependent variable is time, and the independent variable is distance.

Answers: 2


Other questions on the subject: Mathematics
Mathematics, 21.06.2019 16:30, kelseybell2707
Find the greatest common factor of -30x 4 yz 3 and 75x 4 z 2.
Answers: 1
Mathematics, 21.06.2019 18:00, imanim3851
Give all possible names for the line shown. calculation tip: lines can be written with either point first.
Answers: 1
Mathematics, 21.06.2019 19:30, shanua
Needmax recorded the heights of 500 male humans. he found that the heights were normally distributed around a mean of 177 centimeters. which statements about max’s data must be true? a) the median of max’s data is 250 b) more than half of the data points max recorded were 177 centimeters. c) a data point chosen at random is as likely to be above the mean as it is to be below the mean. d) every height within three standard deviations of the mean is equally likely to be chosen if a data point is selected at random.
Answers: 2
Mathematics, 21.06.2019 21:00, ShahinF7536
Graph the equationy=x^2 -[tex]y = x^{2} - 2[/tex]
Answers: 1
You know the right answer?
Jacob is planning a hiking trip for this spring. The graph shows the relationship between time and d...
Questions in other subjects:

Mathematics, 19.05.2021 16:00
Mathematics, 19.05.2021 16:00


