The graphs shown below represent the average temperature in four U. S.
cities at different mon...

Mathematics, 15.04.2020 04:50 Neon29
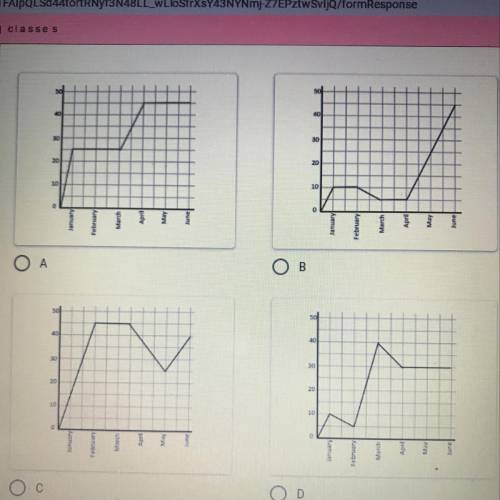
The graphs shown below represent the average temperature in four U. S.
cities at different months throughout the year. Which graph represents
the greatest rate of change from March to April?
need help ASAP .

Answers: 3


Other questions on the subject: Mathematics
Mathematics, 21.06.2019 14:00, ctyrector
Carson has only $20 bills and $10 bill in her wallet. the total value of the bills is $50. she has 1 more $20 bill than $10 bills. how many each kind of bill does carson have? a. one $20 and two $10 bills b. two $20 bills and one $10 bill c. one $20 bills and three $10 bills d. two $20 bills and two $10 bills
Answers: 2
Mathematics, 21.06.2019 23:00, kobiemajak
Jim had 3,067.48 in his checking account he wrote a check to pay for two airplane tickets. his account now has 1,845.24.
Answers: 1
You know the right answer?
Questions in other subjects:


History, 24.09.2019 00:00

Arts, 24.09.2019 00:00

French, 24.09.2019 00:00


