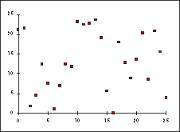
Analyze the data represented in the graph and select the appropriate model.
A) exponenti...

Mathematics, 15.04.2020 04:02 marcedezebrown4736
Analyze the data represented in the graph and select the appropriate model.
A) exponential
B) linear
C) none
D) quadratic

Answers: 2


Other questions on the subject: Mathematics
Mathematics, 21.06.2019 15:30, nsuleban9524
Astore manager records the total visitors and sales, in dollars, for 10 days. the data is shown in the scatter plot. what conclusion can the store manager draw based on the data? question 3 options: an increase in sales causes a decrease in visitors. an increase in sales is correlated with a decrease in visitors. an increase in visitors is correlated with an increase in sales.
Answers: 1
Mathematics, 21.06.2019 20:50, badatmathmate8388
Write the equation in logarithmic form e^x=403.429
Answers: 1
You know the right answer?
Questions in other subjects:


Chemistry, 01.04.2021 19:40

English, 01.04.2021 19:40
Mathematics, 01.04.2021 19:40
Mathematics, 01.04.2021 19:40

Physics, 01.04.2021 19:40
English, 01.04.2021 19:40

Health, 01.04.2021 19:40


