
Mathematics, 15.04.2020 02:00 J3ak06
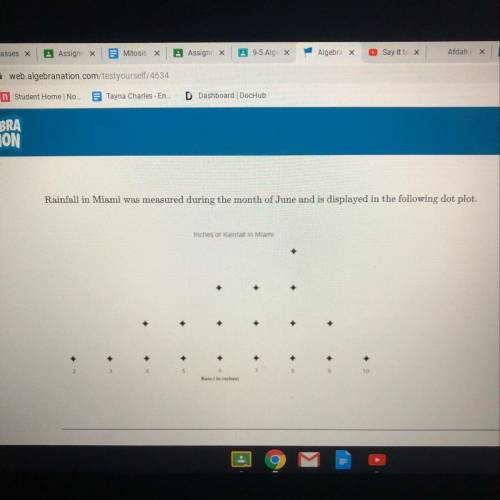
Rainfall in Miami was measured during the month of June and is displayed in the following dot plot.
Inches of Rantal
Miami
Part A: What is the mean and median amount of rainfall of this data set?
Part B: Which measure is more appropriate to describe the center?
Part C: Could this data have a normal distribution?

Answers: 2


Other questions on the subject: Mathematics
Mathematics, 21.06.2019 16:50, thegoat3180
The lines shown below are parallel. if the green line has a slope of -1, what is the slope of the red line?
Answers: 1
Mathematics, 21.06.2019 22:00, rhineharttori
Here is my question! jayne is studying urban planning and finds that her town is decreasing in population by 3% each year. the population of her town is changing by a constant rate. true or false?
Answers: 2
Mathematics, 22.06.2019 00:00, kaitlynnputtere
Which choice names the hypotenuse of triangle xyz? a. segment yx b. segment yz c. segment ab d. segment zx
Answers: 3
You know the right answer?
Rainfall in Miami was measured during the month of June and is displayed in the following dot plot.<...
Questions in other subjects:


Chemistry, 20.04.2020 19:24


Mathematics, 20.04.2020 19:24
Mathematics, 20.04.2020 19:24
Mathematics, 20.04.2020 19:24

Mathematics, 20.04.2020 19:24


