
Mathematics, 15.04.2020 01:23 allyssaharrisooy50au
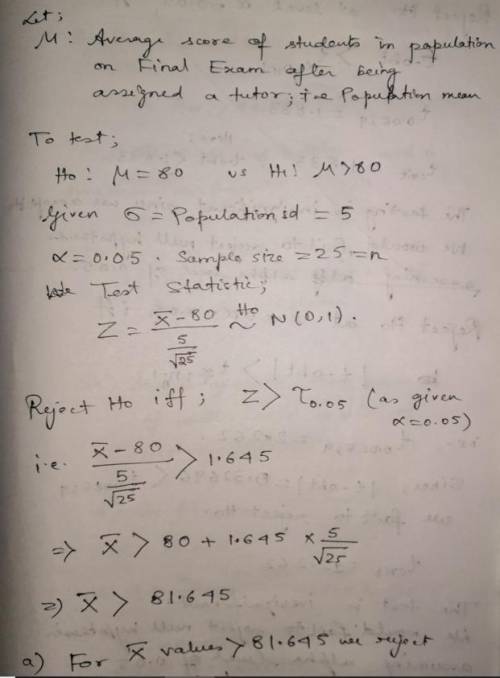
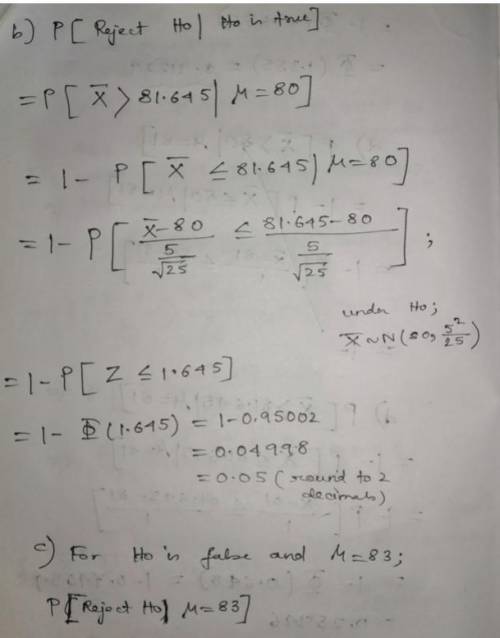
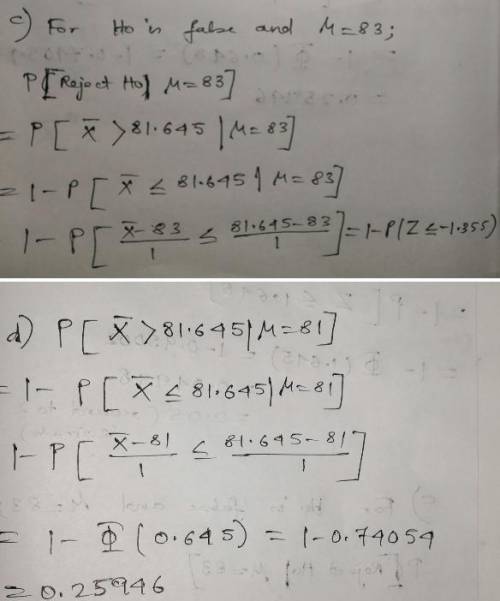
• Historically, students in a statistics course receive an average score of 80 on the final exam with a standard deviation of 5. • One semester, 25 randomly chosen students are assigned a tutor who they meet with once a week. • Let X¯ be the average score on the final exam for those 25 students. • Assume that the standard deviation of final exam scores is completely unaffected by the tutoring, but that the tutoring could potentially increase exam scores (one sided test). Your null hypothesis is that tutoring has zero effect on final exam grades, and you are using a significance level of .05. (a) Under what values of X¯ would you reject the null hypothesis? (b) Suppose the null hypothesis is true. What is the probability of rejecting the null hypothesis? (c) Suppose, the null is false, and tutoring raises scores by 3 points for all students who receive it. What is the probability that X¯ will be far enough away from 80 for you to reject the null hypothesis? (d) What if tutoring raises scores by 1 point. What is the probability that X¯ will be far enough away from 80 for you to reject the null hypothesis? (e) How large would your sample have to be to have a 90% chance of rejecting the null hypothesis (assuming still that tutoring raises scores by 1 point).

Answers: 2


Other questions on the subject: Mathematics
Mathematics, 21.06.2019 17:00, JvGaming2001
Scarlet bought three pairs of sunglasses and two shirts for $81 and paula bought one pair of sunglasses and five shirts for $105 what is the cost of one pair of sunglasses and one shirt?
Answers: 2
Mathematics, 21.06.2019 22:20, keyshawn437
Question 4 of 10 2 points what is the second part of the process of investigating a question using data? a. rephrasing the question o b. describing the data c. collecting the data o d. making an inference submit
Answers: 1
Mathematics, 21.06.2019 22:30, brooklyn4932
1.based of the diagrams what is the the value of x? 2.how would you verify your answer for x
Answers: 1
Mathematics, 22.06.2019 00:20, kaybec2386
Data for the height of a model rocket launch in the air over time are shown in the table. darryl predicted that the height of the rocket at 8 seconds would be about 93 meters. did darryl make a good prediction? yes, the data are best modeled by a quadratic function. the value of the function at 8 seconds is about 93 meters. yes, the data are best modeled by a linear function. the first differences are constant, so about 93 meters at 8 seconds is reasonable. no, the data are exponential. a better prediction is 150 meters. no, the data are best modeled by a cubic function. a better prediction is 100 meters.
Answers: 2
You know the right answer?
• Historically, students in a statistics course receive an average score of 80 on the final exam wit...
Questions in other subjects:


Mathematics, 29.08.2020 01:01
Mathematics, 29.08.2020 01:01


