
Mathematics, 15.04.2020 00:09 jcduarte
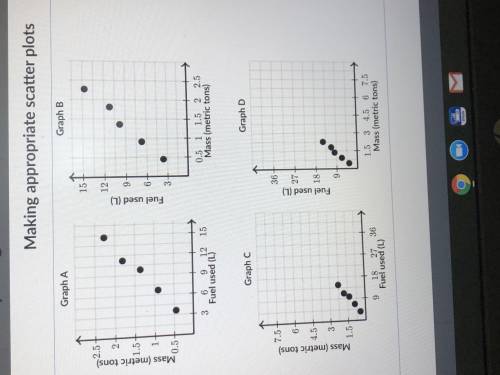
A car company wants to predict how much fuel different cars will use based on their masses. They took a sample of cars, drove each car 100\,\text{km}100km100, start text, k, m, end text, and measured how much fuel was used in each case (in liters). The data is summarized in the table below.
Fuel used (L) 3.6, 6.7, 9.8, 11.2, 14.7
Mass (metric tons) 0.45, 0.91, 1.36, 1.81, 2.27
All of the scatter plots below display the data correctly, but which one of them displays the data best?
By convention, a good scatter plot uses a reasonable scale on both axes and puts the explanatory variable on the x-axis.
Choose 1
(Choice A)
(Choice B)
(Choice C)
(Choice D)

Answers: 3


Other questions on the subject: Mathematics
Mathematics, 21.06.2019 19:30, BaileyElizabethRay
Which graph represents the equation y =4x
Answers: 1
Mathematics, 21.06.2019 22:30, skylarjane1030
9.4.34 question to estimate the height of a stone figure, an observer holds a small square up to her eyes and walks backward from the figure. she stops when the bottom of the figure aligns with the bottom edge of the square, and when the top of the figure aligns with the top edge of the square. her eye level is 1.811.81 m from the ground. she is 3.703.70 m from the figure. what is the height of the figure to the nearest hundredth of a meter?
Answers: 1
You know the right answer?
A car company wants to predict how much fuel different cars will use based on their masses. They too...
Questions in other subjects:


English, 20.09.2020 17:01

Mathematics, 20.09.2020 17:01
Mathematics, 20.09.2020 17:01
Mathematics, 20.09.2020 17:01

History, 20.09.2020 17:01


