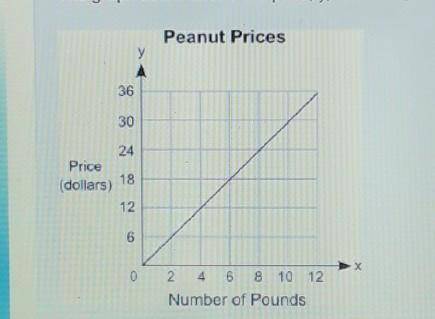
The graph below shows the price, y, in dollars, of different amounts of peanuts, x, in pounds:
...

Mathematics, 15.04.2020 01:53 aurora32
The graph below shows the price, y, in dollars, of different amounts of peanuts, x, in pounds:
Which equation best represents the relationship between x and y?
A. y = x + 6
B. y = 3x
C. y = 6x
D. y = x + 3
(PLEASE NO GUESSING)
:)

Answers: 1


Other questions on the subject: Mathematics
Mathematics, 21.06.2019 20:30, catcatscats122
Write two point-slope equations for the line passing through the points (6, 5) and (3, 1)
Answers: 1
Mathematics, 21.06.2019 21:30, Diazvictoria
Worth 15 points handsome jack is buying a pony made of diamonds. the price of the pony is p dollars, and jack also has to pay a 25% diamond pony tax. which of the following expressions could represent how much jack pays in total for the pony? a= p = 1/4 b= p+0.25p c=(p + 1/4)p d=5/4p 0.25p choose 2 answers
Answers: 1
Mathematics, 21.06.2019 21:40, oprajapati
The management of a supermarket wants to adopt a new promotional policy of giving a free gift to every customer who spends more than a certain amount per visit at this supermarket. the expectation of the management is that after this promotional policy is advertised, the expenditures for all customers at this supermarket will be normally distributed with a mean of $95 and a standard deviation of $20. if the management wants to give free gifts to at most 10% of the customers, what should the amount be above which a customer would receive a free gift?
Answers: 2
You know the right answer?
Questions in other subjects:
Mathematics, 20.05.2020 18:57

Arts, 20.05.2020 18:57


Mathematics, 20.05.2020 18:57

Social Studies, 20.05.2020 18:57


