
Mathematics, 15.04.2020 02:03 lineaeriksen
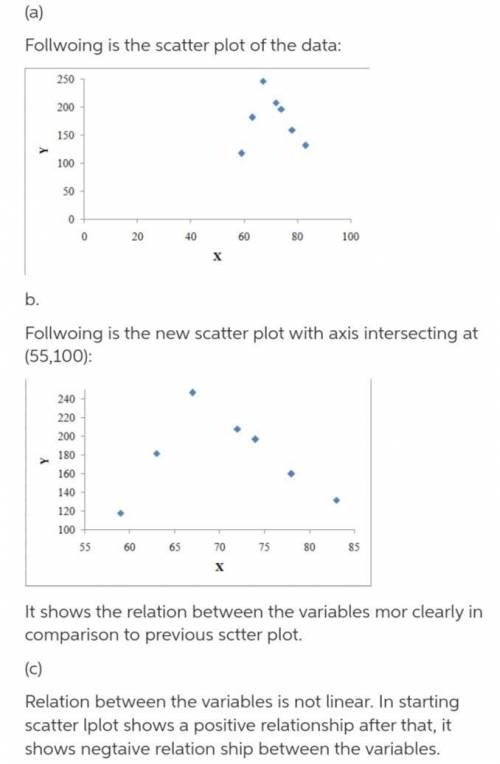
An experiment to investigate how the behavior of mozzarella cheese varied with temperature. Consider the accompanying data on x =temperature and y =elongation(%) at failure of the cheese. a. Construct a scatterplot in which the axes intersect at (0, 0). Mark 0, 20, 40, 60,80, and 100 on the horizontal axis and 0, 50, 100, 150, 200, and 250 on the vertical axis. (2 marks)b. Construct a scatterplot in which the axes intersect at (55, 100).Does this plot seem preferable to the one in part (a)? Explain your reasoning. (2 marks)c. What do the plots of parts (a) and (b) suggest about the nature of the relationship between the two variables

Answers: 1


Other questions on the subject: Mathematics
Mathematics, 21.06.2019 22:40, katerin3499
Explain in a minimum of 2 sentences how to graph the equation of the absolute value function given a vertex of (-1,3) and a value of “a” equal to ½.
Answers: 2
You know the right answer?
An experiment to investigate how the behavior of mozzarella cheese varied with temperature. Consider...
Questions in other subjects:
Mathematics, 05.03.2021 20:50

Mathematics, 05.03.2021 20:50
Mathematics, 05.03.2021 20:50

Mathematics, 05.03.2021 20:50


