Click or tap the number line to add a dot.
Create a dot plot of the data shown below.
20...

Mathematics, 14.04.2020 23:35 Hoeing3195
Click or tap the number line to add a dot.
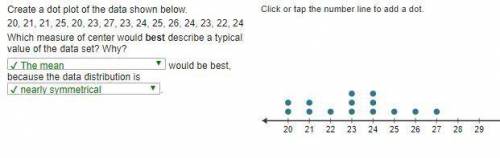
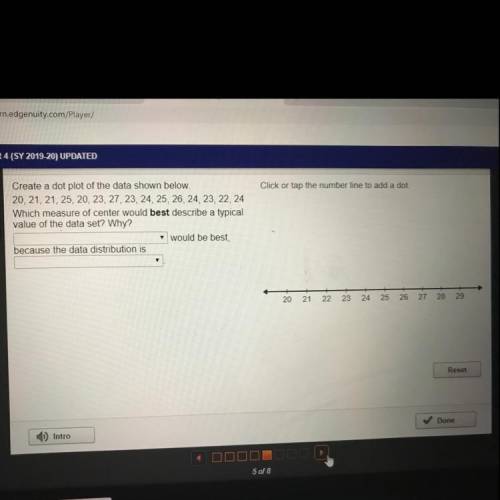
Create a dot plot of the data shown below.
20, 21, 21, 25, 20, 23, 27, 23, 24, 25, 26, 24, 23, 22, 24
Which measure of center would best describe a typical
value of the data set? Why?
would be best
because the data distribution is
20
21
22
23
24
25
26
27
28
29

Answers: 2


Other questions on the subject: Mathematics
Mathematics, 21.06.2019 15:30, jmchmom6066
Strawberries cause two hours per pound kate buys 5 pounds he gets 20% off discount on the total cost how much does kate pay for the strawberries
Answers: 3
Mathematics, 21.06.2019 16:40, mattstudy305
Which recursive formula can be used to determine the total amount of money earned in any year based on the amount earned in the previous year? f(n+1)=f(n)+5
Answers: 1
You know the right answer?
Questions in other subjects:


English, 13.02.2021 07:20


Chemistry, 13.02.2021 07:20
Mathematics, 13.02.2021 07:20


