
Mathematics, 14.04.2020 18:55 jaida03
The table showing the stock price changes for a sample of 12 companies on a day is contained in the Excel file below.
Price Change ($)
0.82
1.44
-0.07
0.41
0.21
1.33
0.97
0.30
0.14
0.12
0.42
0.15
Construct a spreadsheet to answer the following questions.
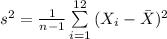
a. Compute the sample variance for the daily price change (to 4 decimals).
b. Compute the sample standard deviation for the price change (to 4 decimals).
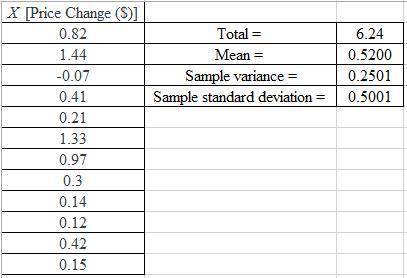
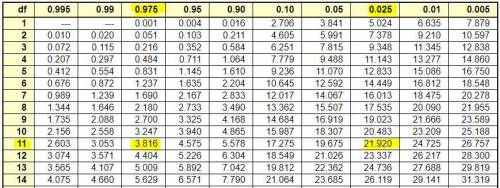
c. Provide 95% confidence interval estimates of the population variance (to 4 decimals).

Answers: 1

 =AVERAGE(A2:A13)
 =VAR.S(A2:A13)
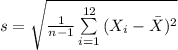
 =STDEV.S(A2:A13)
![CI=[\frac{(n-1)s^{2}}{\chi^{2}_{\alpha/2} } \leq \sigma^{2}\leq \frac{(n-1)s^{2}}{\chi^{2}_{1-\alpha/2} } ]](/tpl/images/0598/7478/a42f6.png)


![=[\frac{(12-1)\times 0.2501}{21.920 } \leq \sigma^{2}\leq \frac{(12-1)\times 0.2501}{3.816} ]](/tpl/images/0598/7478/f887c.png)
![=[0.125506\leq \sigma^{2}\leq 0.720938]\\\approx [0.1255, 0.7210]](/tpl/images/0598/7478/e0a86.png)


Other questions on the subject: Mathematics
Mathematics, 21.06.2019 15:00, camila9022
Can someone answer it, and plot it, for 20 points and brainliest answer? p. s. they're the same ! : )
Answers: 1
Mathematics, 21.06.2019 15:00, katherineweightman
What is the rotational symmetry of a wheel
Answers: 1
Mathematics, 21.06.2019 18:30, Ateruel95
Dakota earned $7.50 in interest in account a and $18.75 in interest in account b after 15 months. if the simple interest rate is 4% for account a and 5% for account b, which account has the greater principal? explain. to make it a little easier, there is an image. good luck!
Answers: 1
Mathematics, 21.06.2019 18:50, livvyr0cks
Find the center and the radius of the circle with the equation: x^2-2x+y^2+4y+1=0?
Answers: 1
You know the right answer?
The table showing the stock price changes for a sample of 12 companies on a day is contained in the...
Questions in other subjects:

Social Studies, 23.04.2021 20:20

History, 23.04.2021 20:20
Mathematics, 23.04.2021 20:20
Mathematics, 23.04.2021 20:20
History, 23.04.2021 20:20
Mathematics, 23.04.2021 20:20
Mathematics, 23.04.2021 20:20


