
Mathematics, 14.04.2020 18:01 QueenNerdy889
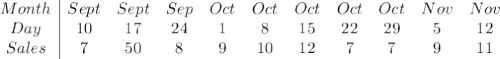
The table below shows school T-shirt sales for the past ten weeks. The school wants to make one more order for the next 30 weeks. How could the school decide how many T-shirts to order?
Date:
Sept Sept Sep Oct Oct Oct Oct Oct Nov Nov
10 17 24 1 8 15 22 29 5 12
Sales:
7 50 8 9 10 12 7 7 9 11
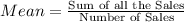
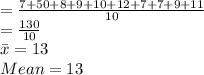
1. What are the mean, median, mode, and range of the T-shirt data shown above?
2. Compare the mean, median, and mode. Which measure seems to best represent the ten numbers? Explain

Answers: 3


Other questions on the subject: Mathematics
Mathematics, 21.06.2019 18:20, Karamatullah
The number if marbles of different colors stored in a hat is listed below: 4 red marbles 10 green marbles 7 blue marbles. without looking in the hat, dan takes out a marble at random. he replaces the marble and then takes out another marble from the hat. what is the probability that dan takes out a blue marble in both draws?
Answers: 1
Mathematics, 22.06.2019 02:30, selenaK9514
Yuto solved the equation below. what is the solution to yuto’s equation?
Answers: 2
Mathematics, 22.06.2019 04:00, Paulalex8765
For what values of a is the sum of the fractions 2a−1 / 4 and a−1 /3 positive?
Answers: 2
Mathematics, 22.06.2019 04:30, rockstargirl7256
Which graph or graphs appear to show a sinusoid? < me asap !
Answers: 1
You know the right answer?
The table below shows school T-shirt sales for the past ten weeks. The school wants to make one more...
Questions in other subjects:

Spanish, 14.02.2021 01:00


Mathematics, 14.02.2021 01:00
Mathematics, 14.02.2021 01:00
Mathematics, 14.02.2021 01:00


