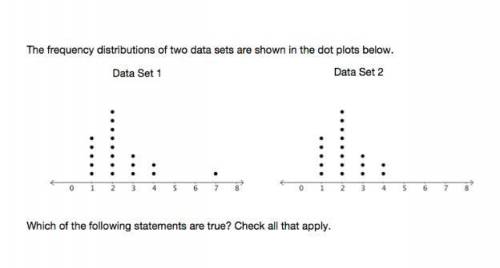
The frequency distribution of two data sets are shown in the dot plots below
...

Mathematics, 14.04.2020 02:22 ajayrose
The frequency distribution of two data sets are shown in the dot plots below

Answers: 2


Other questions on the subject: Mathematics
Mathematics, 21.06.2019 13:00, thisbegaby
Jessica is a custodian at oracle arena. she waxes 20 m2 of the floor in 3/5 of an hour. jessica waxes the floor at a constant rate. at this rate how many sqaures meters can she wax per hour
Answers: 3
Mathematics, 21.06.2019 14:30, tyw3366812778
What are the relative frequencies, to the nearest hundredth, of the rows of the two-way table? group 1: a 15 b 45 group 2: a 20 b 25
Answers: 3
Mathematics, 21.06.2019 16:00, tdun7003
Find the area and perimeter of each composite figure. use 3.14 for π. round your answer to the nearest tenth. a square and a right triangle share a common side. image long description a 3-meter by 0.5-meter rectangle has triangles attached like wings to the 3-meter sides. the other two sides of both triangles measure 2.5 meters. the height of each triangle is 2 meters. a 6-inch by 4-inch rectangle has 2 half-circles attached like wings to the 6-inch sides. the radius of each half-circle is 3 inches. find the surface area and volume of each figure. use 3.14 for π. round your answer to the nearest tenth. a right circular cylinder has a base radius of 6 yards and a height of 20 yards. a rectangular prism has a base that is 9 centimeters long and 7 centimeters wide. the height is 2 centimeters. a rectangular prism has a base that measures 11 millimeters by 11 millimeters. the height is 11 millimeters.
Answers: 1
You know the right answer?
Questions in other subjects:
Mathematics, 26.09.2019 17:00


Biology, 26.09.2019 17:00


