
Mathematics, 14.04.2020 01:53 ilizzy1224
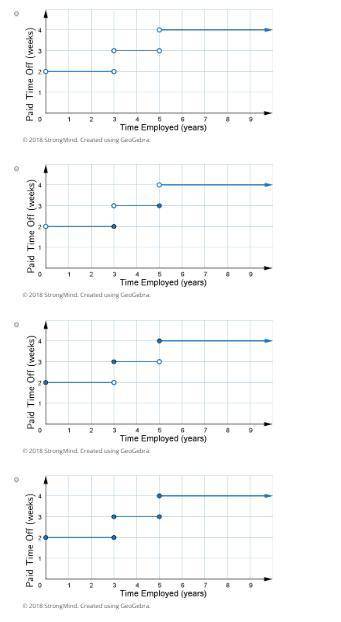
A company offers 2 weeks of paid time off to all of its employees each year. Once an employee is there for three years, they start to get 3 weeks of paid time off each year. Once an employee gets to 5 years, they start to get 4 weeks of paid time off each year.
Which graph correctly shows the amount of paid time off based on the number of years of employment?

Answers: 1


Other questions on the subject: Mathematics
Mathematics, 21.06.2019 20:00, anabelleacunamu
Find the value of x. round the length to the nearest tenth
Answers: 1
Mathematics, 21.06.2019 20:10, jessixa897192
Complete the solution of the equation. find the value of y when x equals -5. -4x - 8y = -52
Answers: 2
Mathematics, 21.06.2019 22:10, mairealexander87
Jayne is studying urban planning and finds that her town is decreasing in population by 3% each year. the population of her town is changing by a constant rate. true or false?
Answers: 1
You know the right answer?
A company offers 2 weeks of paid time off to all of its employees each year. Once an employee is the...
Questions in other subjects:


Social Studies, 05.05.2020 03:34

English, 05.05.2020 03:34

Biology, 05.05.2020 03:35
English, 05.05.2020 03:35


