
Mathematics, 13.04.2020 22:59 cadanceowasso
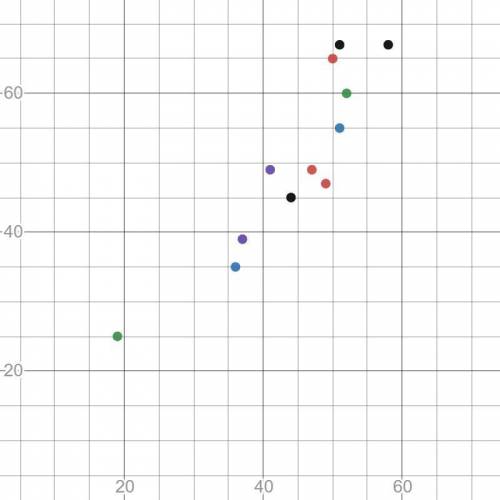
Which variable did you plot on the x-axis, and which variable did you plot on the y-axis? Explain why you assigned the variables in that way.
Write the equation of the line of best fit using the slope-intercept formula $y = mx + b$. Show all your work, including the points used to determine the slope and how the equation was determined.
What does the slope of the line represent within the context of your graph? What does the y-intercept represent?
Test the residuals of two other points to determine how well the line of best fit models the data.
Use the line of best fit to help you to describe the data correlation.
Using the line of best fit that you found in Part Three, Question 2, approximate how tall is a person whose arm span is 66 inches?
According to your line of best fit, what is the arm span of a 74-inch-tall person?

Answers: 3


Other questions on the subject: Mathematics
Mathematics, 21.06.2019 17:00, maryjane8872
Which point lies on a circle with a radius of 5 units and center at p(6, 1)?
Answers: 1
Mathematics, 21.06.2019 22:30, rubycarbajal
The area of a circle is equal to 1 dm². find the radius of the circle.
Answers: 1
Mathematics, 21.06.2019 22:50, zitterkoph
Listed below are time intervals (min) between eruptions of a geyser. assume that the "recent" times are within the past few years, the "past" times are from around 20 years ago, and that the two samples are independent simple random samples selected from normally distributed populations. do not assume that the population standard deviations are equal. does it appear that the mean time interval has changed? is the conclusion affected by whether the significance level is 0.10 or 0.01? recent 78 90 90 79 57 101 62 87 71 87 81 84 57 80 74 103 62 past 88 89 93 94 65 85 85 92 87 91 89 91 follow the steps of hypothesis testing, including identifying the alternative and null hypothesis, calculating the test statistic, finding the p-value, and making a conclusions about the null hypothesis and a final conclusion that addresses the original claim. use a significance level of 0.10. is the conclusion affected by whether the significance level is 0.10 or 0.01? answer choices below: a) yes, the conclusion is affected by the significance level because h0 is rejected when the significance level is 0.01 but is not rejected when the significance level is 0.10. b) no, the conclusion is not affected by the significance level because h0 is not rejected regardless of whether a significance level of 0.10 or 0.01 is used. c) yes, the conclusion is affected by the significance level because h0 is rejected when the significance level is 0.10 but is not rejected when the significance level is 0.01. d) no, the conclusion is not affected by the significance level because h0 is rejected regardless of whether a significance level of 0.10 or 0.01 is used.
Answers: 3
You know the right answer?
Which variable did you plot on the x-axis, and which variable did you plot on the y-axis? Explain wh...
Questions in other subjects:


Advanced Placement (AP), 21.12.2020 19:00

Law, 21.12.2020 19:00

History, 21.12.2020 19:00

Mathematics, 21.12.2020 19:00


