
Mathematics, 13.04.2020 17:43 brookebeatrice8
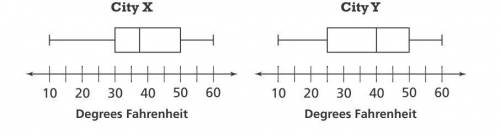
The box plots show the daily average high temperatures of two cities from January to December. Which city should you live in if you want a greater variability in temperature? Explain.

Answers: 2


Other questions on the subject: Mathematics
Mathematics, 21.06.2019 15:30, xxxamslashxxx9
Data was collected on myrtle beach for 11 consecutive days. each day the temperature and number of visitors was noted. the scatter plot below represents this data. how many people visited the beach when the temperature was 84 degrees?
Answers: 1
Mathematics, 21.06.2019 23:40, yarrito20011307
20 ! jason orders a data set from least to greatest. complete the sentence by selecting the correct word from each drop-down menu. the middle value of the data set is a measure and is called the part a: center b: spread part b: mean a: mean absolute deviation b: median c: range
Answers: 1
You know the right answer?
The box plots show the daily average high temperatures of two cities from January to December. Which...
Questions in other subjects:


History, 01.03.2021 22:00

Biology, 01.03.2021 22:00

Mathematics, 01.03.2021 22:00
Mathematics, 01.03.2021 22:00
Mathematics, 01.03.2021 22:00


