
Mathematics, 11.04.2020 22:12 bgallman153p71edg
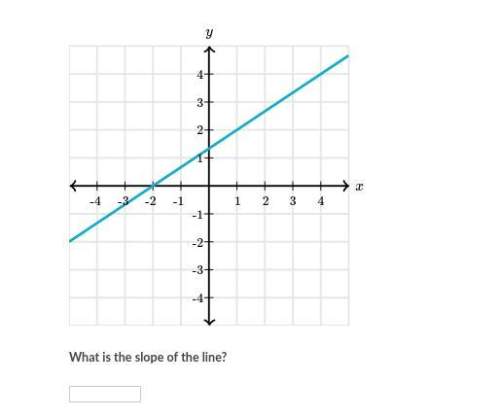
The number of calls that the employees in a call center took on Wednesday were recorded and combined in the histogram below.
Which of the following statements describe the distribution?
The mean is the best measure of center.
The median is the best measure of center.
The data is spread out with no gaps.
The data is close together without any outliers.
The mean absolute deviation is the best measure of variability.
The data has one striking deviation.
The interquartile range is the best measure of variability.

Answers: 2


Other questions on the subject: Mathematics
Mathematics, 21.06.2019 17:30, harpermags7830
Which of the following is true for the relation f(x)=2x^2+1
Answers: 1
Mathematics, 21.06.2019 20:00, tansebas1107
Can you me find the missing length. i attached an image.
Answers: 1
Mathematics, 21.06.2019 20:30, jthollis1348
Which expression is equivalent to (4 +6i)^2? ? -20 + 48i 8 + 12i 16 - 36i 20 + 48i
Answers: 1
You know the right answer?
The number of calls that the employees in a call center took on Wednesday were recorded and combined...
Questions in other subjects:

English, 14.02.2020 18:16

Mathematics, 14.02.2020 18:16
Mathematics, 14.02.2020 18:16


