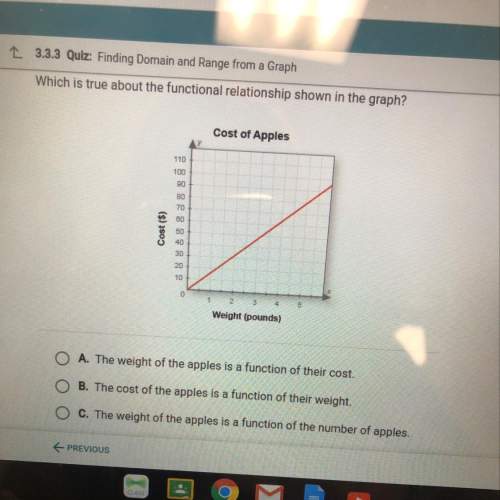
A survey was performed and data was collected of preference of vehicle based on gender.
Prefer...

Mathematics, 10.04.2020 18:38 simrankaurdhatt
A survey was performed and data was collected of preference of vehicle based on gender.
Prefers Sport
Utility Vehicle
(SUV
21
Prefers
Sports Car
Totals
Male
60
Female
45
180
135
156
Totals
240
Use the frequency table to answer the following questions.
The number of individuals surveyed was
The number of females who preferred SUVs was
The percent of surveyed individuals who preferred a sports car was

Answers: 1


Other questions on the subject: Mathematics
Mathematics, 21.06.2019 15:30, lberman2005p77lfi
Answer question above and explain each step : )
Answers: 3
Mathematics, 21.06.2019 17:10, Halessoftball
Jessica and martha each have a bag of cookies with unequal quantities. they have 30 cookies total between the two of them. each of them ate 6 cookies from their bag. the product of the number of cookies left in each bag is not more than 80. how many more cookies will jessica have martha? if x represents the number of cookies jessica started with, complete the statements below. the inequality that describes the relationship between the number of cookies each one of them has is x^2 - x +224 > = 0.jessica has at least cookies more than martha.
Answers: 3
You know the right answer?
Questions in other subjects:
Mathematics, 18.03.2021 02:30
Mathematics, 18.03.2021 02:30


History, 18.03.2021 02:30
Mathematics, 18.03.2021 02:30
Mathematics, 18.03.2021 02:30


