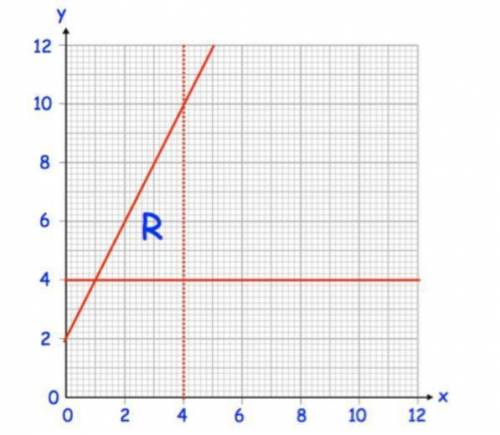
The region R in the graph represents a baker's profits.
The region R in the graph repres...

Mathematics, 10.04.2020 12:00 sebastianartiloufym8
The region R in the graph represents a baker's profits.
The region R in the graph represents a baker's profits.
If she sells x breads for $4 and y pies for $5, what is the maximum amount of profits she can make in a day?

Answers: 2


Other questions on the subject: Mathematics
Mathematics, 21.06.2019 17:00, JOEREACH
Use the expression below.–4b + 8c + 12 – 8b – 2c + 6part asimplify the expression. enter your answers in the boxes. b + c + part bfactor the simplified expression using the gcf. a. 2(–2b + c + 3) b. 3(–2b + c + 3) c. 4(–2b + c + 3) d. 6(–2b + c + 3)part cwhat is the value of the expression when b = 2 and c = –3? enter your answer in the box.
Answers: 1
Mathematics, 21.06.2019 19:00, jthollis1348
Find the y-intercept and x-intercept for the equation 5x-3y=60 what is the y-intercept
Answers: 1
Mathematics, 21.06.2019 20:00, Irenesmarie8493
The graph and table shows the relationship between y, the number of words jean has typed for her essay and x, the number of minutes she has been typing on the computer. according to the line of best fit, about how many words will jean have typed when she completes 60 minutes of typing? 2,500 2,750 3,000 3,250
Answers: 3
You know the right answer?
Questions in other subjects:


English, 02.06.2021 16:50


Mathematics, 02.06.2021 16:50

Mathematics, 02.06.2021 16:50


