
Mathematics, 09.04.2020 18:34 KingKD
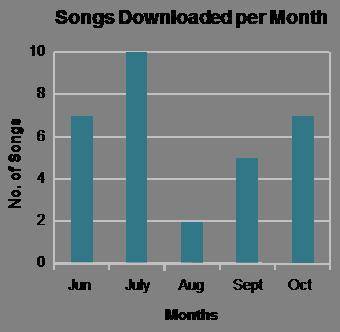
A bar graph titled Songs Downloaded per Month has months on the x-axis and number of songs on the y-axis. June had 7 songs; July, 10; August, 2; September, 5; October, 7.
The bar graph shows the number of songs Karen downloaded each month. Use the data to find each listed value.
Median =
Lower quartile =
Upper quartile =
Interquartile range =

Answers: 1


Other questions on the subject: Mathematics
Mathematics, 21.06.2019 16:00, heids17043
Select all the correct answers. what is 221,000,000,000,000,000,000 expressed in scientific notation?
Answers: 2
Mathematics, 21.06.2019 17:00, zacksoccer8279
Me! last question, and i'm stuck! write the algebraic expression that models the word phrase. the product of 2 divided by the number h and 8 more than the number k
Answers: 1
You know the right answer?
A bar graph titled Songs Downloaded per Month has months on the x-axis and number of songs on the y-...
Questions in other subjects:

Chemistry, 26.09.2019 08:10

History, 26.09.2019 08:10
Mathematics, 26.09.2019 08:10
History, 26.09.2019 08:10

Health, 26.09.2019 08:10

Mathematics, 26.09.2019 08:10


