
Mathematics, 09.04.2020 05:03 hi105
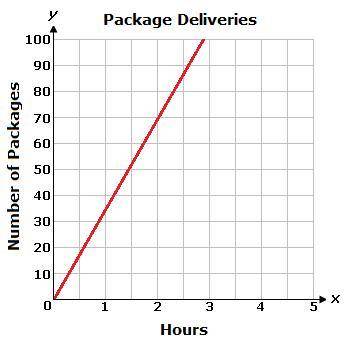
The graph below shows the number of packages a company delivers each hour during the holiday season.
Which of the following is the dependent variable?
A. number of packages
B. hours
C. neither hours nor number of packages
D. both hours and number of packages

Answers: 2


Other questions on the subject: Mathematics
Mathematics, 21.06.2019 15:40, sciencecreation87
Sara needs to take a taxi to get to the movies the taxi charges $4.00 for the first mile and then $2.75 for each mile after that if the total charge is $20.50 then how far was sara’s taxi ride to the movie
Answers: 2
Mathematics, 21.06.2019 22:30, gunnatvinson
If a line is defined by the equation y = 5x + 2, what is the slope?
Answers: 2
Mathematics, 21.06.2019 22:30, qveensentha59
Which of the functions below could have created this graph?
Answers: 1
You know the right answer?
The graph below shows the number of packages a company delivers each hour during the holiday season....
Questions in other subjects:

Mathematics, 05.05.2021 15:50
Mathematics, 05.05.2021 15:50
Mathematics, 05.05.2021 15:50
Mathematics, 05.05.2021 15:50
Mathematics, 05.05.2021 15:50


Chemistry, 05.05.2021 15:50

English, 05.05.2021 15:50


