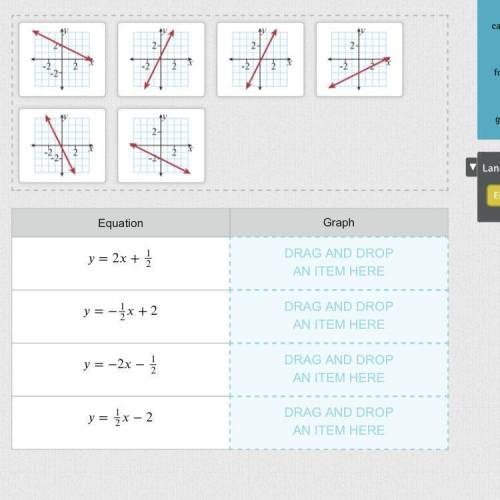
Drag graphs to show a graph of each equation in the table
...

Mathematics, 09.04.2020 03:55 makaylahunt
Drag graphs to show a graph of each equation in the table

Answers: 2


Other questions on the subject: Mathematics
Mathematics, 21.06.2019 21:40, ur4286
Scores on the cognitive scale of the bayley-scales of infant and toddler development range from 1 to 19, with a standard deviation of 3. calculate the margin of error in estimating the true mean cognitive scale score, with 99% confidence, if there are 12 infants and toddlers in a sample.
Answers: 3
Mathematics, 22.06.2019 01:30, babbybronx
When you find the area of a triangle do you use in. or in2
Answers: 2
You know the right answer?
Questions in other subjects:

History, 05.10.2019 00:00


English, 05.10.2019 00:00


