
Mathematics, 09.04.2020 01:00 kassi2007
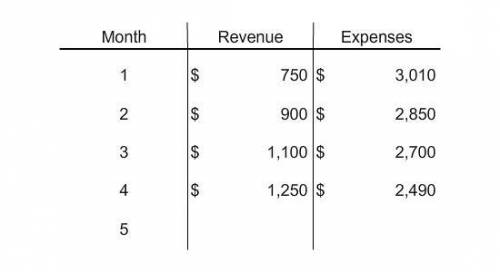
Graph the information presented in the table. Use that graph to predict the week that revenue will equal expenses for this small company.
Note: Revenue and Expenses are drawn on the vertical axis and Month is on the horizontal axis.
(A) Week 6
(B) Week 8
(C) Week 5
(D) Week 7

Answers: 2


Other questions on the subject: Mathematics
Mathematics, 21.06.2019 21:00, gujacksongu6
M. xyz =radians. covert this radian measure to its equivalent measure in degrees.
Answers: 1
Mathematics, 22.06.2019 00:00, broooooo4991
Alice is paying her bill at a restaurant. but tax on the cost of a male is 5%. she decides to leave a tip 20% of the cost of the meal plus the tax
Answers: 3
You know the right answer?
Graph the information presented in the table. Use that graph to predict the week that revenue will e...
Questions in other subjects:


English, 22.02.2020 09:54
Mathematics, 22.02.2020 09:55
Mathematics, 22.02.2020 09:56
Mathematics, 22.02.2020 09:58


