
Mathematics, 08.04.2020 21:36 ykluhredd
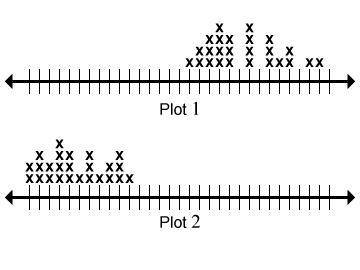
Arthur is using the dot plots to compare two sets of data. Both plots use the same number line. Which choice most likely describes the data sets Arthur is comparing?
a. Plot 1 - shoe sizes of boys in the class
Plot 2 - shoe sizes of girls in the class
b. Plot 1 - the weights of sumo wrestlers
Plot 2 - the weights of Olympic gymnasts
c. Plot 1 - weights of 25 books in grams
Plot 2 - weights of the same 25 books in kilograms
d. Plot 1 - cost of new homes in dollars
Plot 2 - heights of newborn babies

Answers: 2


Other questions on the subject: Mathematics
Mathematics, 20.06.2019 18:04, luislopez05
A80-foot piece of siding is cut into three pieces so that the second piece is four times four times as long as the first piece and the third piece is five times as long as the first piece. if x represents the length of the first piece, find the lengths of all three pieces.
Answers: 1
Mathematics, 21.06.2019 14:20, blakemccain1928
Which linear inequality is represented by the graph? !
Answers: 2
Mathematics, 21.06.2019 15:30, lyndamahe0
Come up with a new linear function that has a slope that falls in the range 10 m − < < . choose two different initial values. for this new linear function, what happens to the function’s values after many iterations? are the function’s values getting close to a particular number in each case?
Answers: 1
Mathematics, 21.06.2019 20:40, mruffier6239
In a 45-45-90 right triangle, what is the ratio of the length of one leg to the length of the other leg? а . 1: 2 в. 2: 1 с. 2: 1 d. 1: 1
Answers: 1
You know the right answer?
Arthur is using the dot plots to compare two sets of data. Both plots use the same number line. Whic...
Questions in other subjects:
Mathematics, 25.02.2021 23:10


History, 25.02.2021 23:10
Mathematics, 25.02.2021 23:10
History, 25.02.2021 23:10


Mathematics, 25.02.2021 23:10


