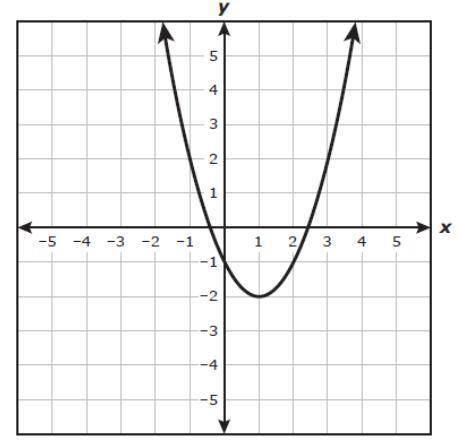
A graph of a quadratic function is shown on the grid.
Which coordinates bets represent th...

Mathematics, 08.04.2020 17:13 mairadua14
A graph of a quadratic function is shown on the grid.
Which coordinates bets represent the vertex of the graph?
(1, -2)
(-0.4, 0)
(0, -1)
(2.4, 0)

Answers: 3


Other questions on the subject: Mathematics
Mathematics, 21.06.2019 17:30, meganenaranjo
If the speed of an electromagnetic wave is 100,000 cm/s and its wavelength is 100 cm, what is its frequency? a) 100,000 cycles per second (hz) b) 1 × 10⁻³ cycles per second (hz) c) 10,000,000 cycles per second (hz) d) 1,000 cycles per second (hz)
Answers: 1
Mathematics, 21.06.2019 21:00, desirekotta20
An account with a $250 balance accrues 2% annually. if no deposits or withdrawals are made, which graph can be used to determine approximately how many years will it take for the balance to be $282? it's e2020 ni️️as
Answers: 1
Mathematics, 21.06.2019 23:30, abell23000
Afriend of mine is giving a dinner party. his current wine supply includes 10 bottles of zinfandel, 8 of merlot, and 11 of cabernet (he only drinks red wine), all from different wineries. (a) if he wants to serve 3 bottles of zinfandel and serving order is important, how many ways are there to do this? ways (b) if 6 bottles of wine are to be randomly selected from the 29 for serving, how many ways are there to do this? ways (c) if 6 bottles are randomly selected, how many ways are there to obtain two bottles of each variety? ways (d) if 6 bottles are randomly selected, what is the probability that this results in two bottles of each variety being chosen? (round your answer to three decimal places.) (e) if 6 bottles are randomly selected, what is the probability that all of them are the same variety? (round your answer to three decimal places.)
Answers: 3
Mathematics, 22.06.2019 02:00, 791197
Will make ! for correct answer the dot plot below shows the number of toys 21 shops sold in an hour. is the median or the mean a better center for this data and why? a. median; because the data is not symmetric and there are outliersb. median; because the data is symmetric and there are no outliersc. mean; because the data is symmetric and there are no outliersd. mean; because the data is skewed and there are outliers
Answers: 2
You know the right answer?
Questions in other subjects:


Mathematics, 25.02.2020 10:53

Social Studies, 25.02.2020 10:54


