
Mathematics, 07.04.2020 04:56 debo4965
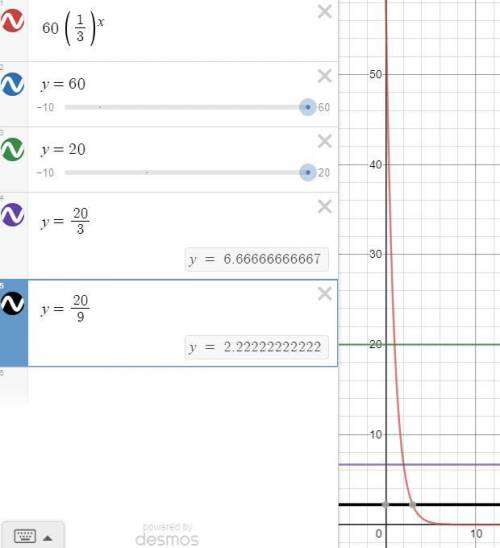
Which is the best description of the graph of the function f(x) = 60(One-third)x? The graph has an initial value of 20, and each successive term is determined by subtracting One-third. The graph has an initial value of 20, and each successive term is determined by multiplying by One-third. The graph has an initial value of 60, and each successive term is determined by subtracting One-third. The graph has an initial value of 60, and each successive term is determined by multiplying by One-third.

Answers: 2


Other questions on the subject: Mathematics
Mathematics, 22.06.2019 04:00, havenlynn27
Order the integers from least to greatest. =0 =1 =2 =3 = -3
Answers: 2
You know the right answer?
Which is the best description of the graph of the function f(x) = 60(One-third)x? The graph has an i...
Questions in other subjects:


Mathematics, 26.04.2021 22:30

Mathematics, 26.04.2021 22:30


