
Mathematics, 07.04.2020 03:19 whatnowb
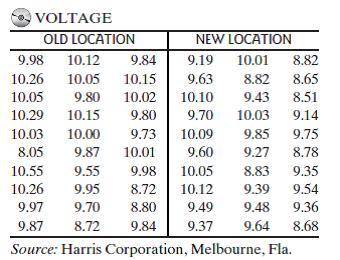
A study was conducted to test whether a manufacturing process performed at a remote location can be established locally. Test devices (pilots) were set up at both the old and new locations and voltage readings on 30 production runs at each location were obtained. The data are reproduced in the table below:
VOLTAGE
Old Location New Location
9.98 10.12 9.84 9.19 10.01 8.82
10.26 10.05 10.15 9.63 8.82 8.65
10.05 9.80 10.02 10.10 9.43 8.51
10.29 10.15 9.80 9.70 10.03 9.14
10.03 10.00 9.73 10.09 9.85 9.75
8.05 9.87 10.01 9.60 9.27 8.78 10.55 9.55 9.98 10.05 8.83 9.35
10.26 9.95 8.72 10.12 9.39 9.54
9.97 9.70 8.80 9.49 9.48 9.36
9.87 8.72 9.84 9.37 9.64 8.68
Required:
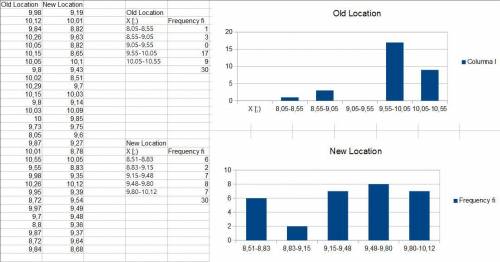
a. Construct a relative frequency histogram for the voltage readings of the old process.
b. Construct a stem-and-leaf display for the voltage readings of the old process. Which of the two graphs in parts a and b is more informative about where most of the voltage readings lie?
c. Construct a relative frequency histogram for the voltage readings of the new process.
d. Compare the two graphs in parts a and c. (You may want to draw the two histograms on the same graph.) Does it appear that the manufacturing process can be established locally (i. e., is the new process as good as or better than the old)?
e. Find and interpret the mean, median, and mode for each of the voltage readings data sets. Which is the preferred measure of central tendency? Explain.
f. Calculate the z-score for a voltage reading of 10.50 at the old location.
g. Calculate the z-score for a voltage reading of 10.50 at the new location.
h. Based on the results of parts f and g, at which location is a voltage reading of 10.50 more likely to occur? Explain.
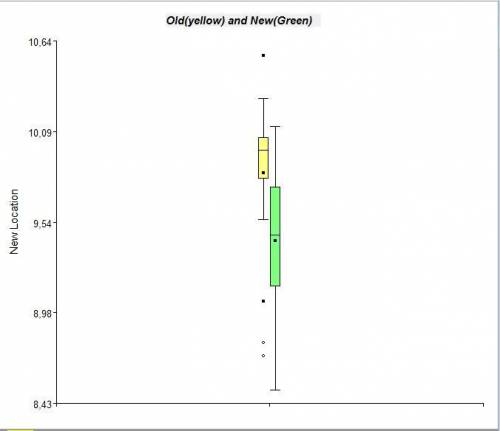
i. Construct a box plot for the data at the old location. Do you detect any outliers?
j. Use the method of z-scores to detect outliers at the old location.
k. Construct a box plot for the data at the new location. Do you detect any outliers?
l. Use the method of z-scores to detect outliers at the new location.
m. Compare the distributions of voltage readings at the two locations by placing the box plots, parts i and k, side by side vertically.

Answers: 2


Other questions on the subject: Mathematics
Mathematics, 21.06.2019 13:40, HomeWorkForLife
The pressure exerted on the walls of a container by a gas enclosed within it is directly proportional to the temperature of the gas. if the pressure is 6 pounds per square inch when the temperature is find the pressure exerted when the temperature of the gas is 380 degrees f show work for the
Answers: 2
Mathematics, 21.06.2019 19:20, SmolBeanPotato
Aefg - almn. find the ratio of aefg to almn. a)1: 4 b)1: 2 c)2.1 d)4: 1
Answers: 1
You know the right answer?
A study was conducted to test whether a manufacturing process performed at a remote location can be...
Questions in other subjects:


Social Studies, 22.09.2021 20:30
Biology, 22.09.2021 20:30
Mathematics, 22.09.2021 20:30

English, 22.09.2021 20:30


