
Mathematics, 07.04.2020 02:14 haha396
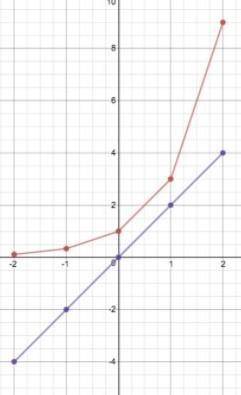
A. Plot the data for the functions ƒ(x) and g(x) on a grid. x -2 -1 0 1 2 ƒ(x) 1 4 16 x -1 0 1 2 3 g(x) 3 4 5 6 7 b. Identify each function as linear, quadratic, or exponential, and use complete sentences to explain your choices. c. Describe what happens to the function values in each function as x increases from left to right. d. At what value(s) of x are the function values equal? If you cannot give exact values for x, give estimates.

Answers: 2


Other questions on the subject: Mathematics
Mathematics, 22.06.2019 00:00, paytonpaige22
The function f(x)= x5+ ( x + 3)2 is used to create a table. if x = -1 then what is f(x)?
Answers: 1
You know the right answer?
A. Plot the data for the functions ƒ(x) and g(x) on a grid. x -2 -1 0 1 2 ƒ(x) 1 4 16 x -1 0 1 2 3 g...
Questions in other subjects:

Business, 23.09.2021 19:00
Mathematics, 23.09.2021 19:00


Mathematics, 23.09.2021 19:00
Mathematics, 23.09.2021 19:00

English, 23.09.2021 19:00


