
Mathematics, 06.04.2020 23:10 cristinavalencia03
Every few years, the National Assessment of Educational Progress asks a national sample of eighth-graders to perform the same math tasks. The goal is to get an honest picture of progress in math. Suppose these are the last few national mean scores, on a scale of 0 to 500.
Year 1990 1992 1996 2000 2003 2005 2008
Score 263 268 271 272 276 277 279
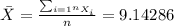
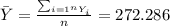
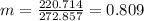
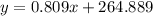
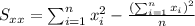
(a) Find the regression line of mean score on time step-by-step. First calculate the mean and standard deviation of each variable and their correlation (use a calculator with these functions). Then find the equation of the least-squares line from these
(b) What percent of the year-to-year variation in scores is explained by the linear trend?

Answers: 1

![r=\frac{n(\sum xy)-(\sum x)(\sum y)}{\sqrt{[n\sum x^2 -(\sum x)^2][n\sum y^2 -(\sum y)^2]}}](/tpl/images/0585/0730/ec454.png)
![r=\frac{7(17647)-(64)(1906)}{\sqrt{[7(858) -(64)^2][7(519164) -(1906)^2]}}=0.97599](/tpl/images/0585/0730/738ef.png)


 and we got:


Other questions on the subject: Mathematics
Mathematics, 21.06.2019 15:00, katiebotts18
The diameter of a ball is 8 in. what is the volume of the ball? use 3.14 for pi. enter your answer as a decimal in the box. round only your final answer to the nearest hundredth.
Answers: 2
Mathematics, 21.06.2019 18:00, roseemariehunter12
Ammonia molecules have three hydrogen atoms and one nitrogen atom. how many of each atom arein five molecules of ammonia
Answers: 1
You know the right answer?
Every few years, the National Assessment of Educational Progress asks a national sample of eighth-gr...
Questions in other subjects:

Chemistry, 14.04.2021 04:50

Mathematics, 14.04.2021 04:50
Mathematics, 14.04.2021 04:50

Arts, 14.04.2021 04:50
Mathematics, 14.04.2021 04:50


