
Mathematics, 06.04.2020 22:40 mechelllcross
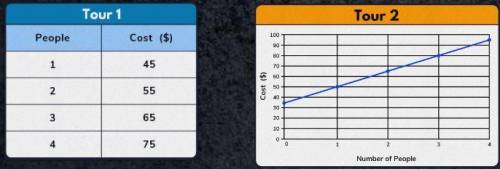
The table and the graph represent 2 different bus tours, showing the cost as a linear function of the number of people in the group
-
Question:
Which description best compares the two functions?
A. They have the same rate of change
B. They have the same initial value
C. The rate of change for Tour 2 is greater
D. They are both the same

Answers: 3


Other questions on the subject: Mathematics
Mathematics, 21.06.2019 21:30, jstringe424
This is a map of the mars exploration rover opportunity predicted landing site on mars. the scale is 1cm : 9.4km. what are the approximate measures of the actual length and width of the ellipse? i mostly need to know how to set it up : )
Answers: 3
Mathematics, 22.06.2019 01:00, carolhubble
The balance of susu's savings account can be represented by the variable b. the inequality describing her balance b > $30 . which could be a solution to the inequality?
Answers: 2
You know the right answer?
The table and the graph represent 2 different bus tours, showing the cost as a linear function of th...
Questions in other subjects:

Health, 13.09.2019 21:10

Spanish, 13.09.2019 21:10
Mathematics, 13.09.2019 21:10

Mathematics, 13.09.2019 21:10
Mathematics, 13.09.2019 21:10


