
Mathematics, 06.04.2020 22:07 emily9656
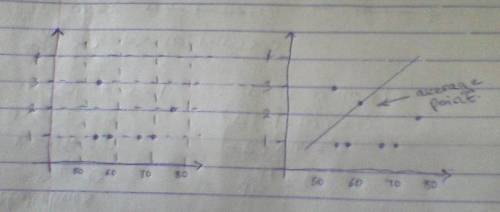
The Report of the Presidential Commission on the Space Shuttle Challenger Accident in 1986 shows a plot of the calculated joint temperature in Fahrenheit and the number of O-rings that had some thermal distress. You collect the data for the seven flights for which thermal distress was identified before the fatal flight and produce the accompanying plot. 4 C0 2 50 60 70 80 Temperature (a) Do you see any relationship between the temperature and the number of O-ring failures? If you fitted a linear regression line through these seven observations, do you think the slope would be positive or negative? Significantly differ- ent from zero? Do you see any problems other than the sample size in your procedure?

Answers: 3


Other questions on the subject: Mathematics
Mathematics, 21.06.2019 19:30, leannamat2106
Which statements are true? check all that apply. the line x = 0 is perpendicular to the line y = –3. all lines that are parallel to the y-axis are vertical lines. all lines that are perpendicular to the x-axis have a slope of 0. the equation of the line parallel to the x-axis that passes through the point (2, –6) is x = 2. the equation of the line perpendicular to the y-axis that passes through the point (–5, 1) is y = 1.
Answers: 1
Mathematics, 21.06.2019 22:00, danielahalesp87vj0
18 16 11 45 33 11 33 14 18 11 what is the mode for this data set
Answers: 2
You know the right answer?
The Report of the Presidential Commission on the Space Shuttle Challenger Accident in 1986 shows a p...
Questions in other subjects:
Mathematics, 22.10.2020 18:01

Biology, 22.10.2020 18:01

History, 22.10.2020 18:01


Mathematics, 22.10.2020 18:01

Physics, 22.10.2020 18:01


