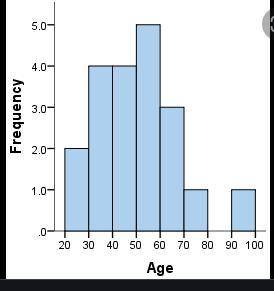
A group of 22 students participated in a race. Their scores are below:
Score (points) <...

Mathematics, 06.04.2020 05:25 ayoismeisalex
A group of 22 students participated in a race. Their scores are below:
Score (points)
4–5
6–7
8–9
10–11
12–13
Number of Students
3
5
8
4
2
Would a dot plot or a histogram best represent the data presented here? Why?
Dot plot, because a large number of scores are reported as ranges
Dot plot, because a small number of scores are reported individually
Histogram, because a large number of scores are reported as ranges
Histogram, because a small number of scores are reported individually

Answers: 3


Other questions on the subject: Mathematics

Mathematics, 21.06.2019 19:30, pillgiing
Acar started driving from city a to city b, distance between which is 620 miles, at a rate of 60 mph. two hours later a truck left city b and started moving towards city a at a rate of 40 mph. what distance from city a is the point where the truck and the car will meet?
Answers: 1

Mathematics, 21.06.2019 21:30, neptunesx
Students are given 3 minutes to complete each multiple-choice question on a test and 8 minutes for each free-responsequestion. there are 15 questions on the test and the students have been given 55 minutes to complete itwhich value could replace x in the table? 5507-m23-m8(15-m)8(15)-m
Answers: 2

Mathematics, 21.06.2019 23:30, ayoismeisalex
In order for the function to be linear, what must m be and why? m = 22 because the rate of change is 1. m = 20 because the rate of change is 3. m = 22 because the rate of change is -1. m = 20 because the rate of change is -3.
Answers: 2

Mathematics, 22.06.2019 02:30, aidenmanpig
Match each set of points with the quadratic function whose graph passes through those points
Answers: 1
You know the right answer?
Questions in other subjects:


Mathematics, 01.03.2020 00:36

Arts, 01.03.2020 00:36


History, 01.03.2020 00:36


Mathematics, 01.03.2020 00:36

Mathematics, 01.03.2020 00:36


Mathematics, 01.03.2020 00:37


