Use the information below to sketch a graph of the polynomial
function y = f(x).
• f(x)...

Mathematics, 06.04.2020 04:51 AdoNice
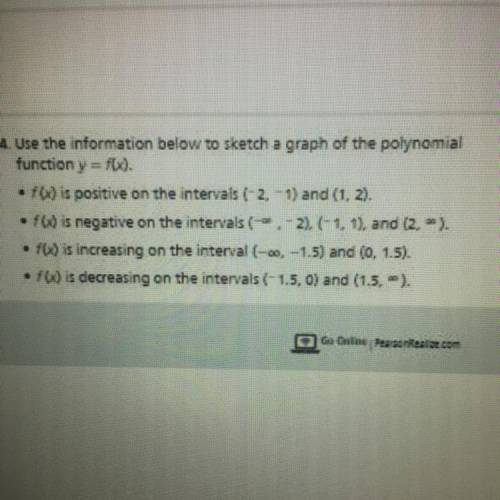
Use the information below to sketch a graph of the polynomial
function y = f(x).
• f(x) is positive on the intervals (-2, -1) and (1, 2).
• F(x) is negative on the intervals (-- .-2), (-1, 1), and (2. ”).
• f(x) is increasing on the interval (-0, -1.5) and (o. 1,5).
• F(x) is decreasing on the intervals (-1.5.0) and (1.5. ~).

Answers: 1


Other questions on the subject: Mathematics
Mathematics, 22.06.2019 01:20, anarosa331hotmailcom
Which equation is represented by the graph below?
Answers: 2
You know the right answer?
Questions in other subjects:


History, 24.04.2020 00:20
Mathematics, 24.04.2020 00:20
Mathematics, 24.04.2020 00:20


