
Mathematics, 05.04.2020 21:57 knowingwhat
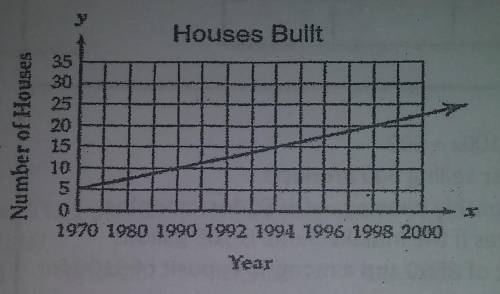
The graph shows the number of new houses built from 1970 to 2000. The mayor used the graph to claim the number built increased at a constant rate.
A) It is valid because the graph shows a constant rate of change.
B) It is valid because 30 years is long enough to evaluate the increase.
C) It is not valid because the scale on the vertical axis is inappropriate.
D) It is not valid because the scale on the horizontal axis is inappropriate.

Answers: 1


Other questions on the subject: Mathematics
Mathematics, 21.06.2019 18:20, vic2nvsty
Alana has 12.5 cups of flour with which she is baking four loaves of raisin bread and one large pretzel. the pretzel requires 2.5 cups of flour to make. how much flour is in each loaf of raisin bread? explain the steps to follow to get the answer.
Answers: 3
Mathematics, 21.06.2019 20:00, oofoofoof1
Fred has a spinner that is split into four equal sections: red, blue, green, and yellow. fred spun the spinner 688 times. which of the following would be a good estimate of the number of times the spinner lands on the green section? a. 269 b. 603 c. 344 d. 189
Answers: 1
You know the right answer?
The graph shows the number of new houses built from 1970 to 2000. The mayor used the graph to claim...
Questions in other subjects:


Mathematics, 13.07.2019 19:30
Mathematics, 13.07.2019 19:30


