
Mathematics, 05.04.2020 02:49 jaedenevan062907
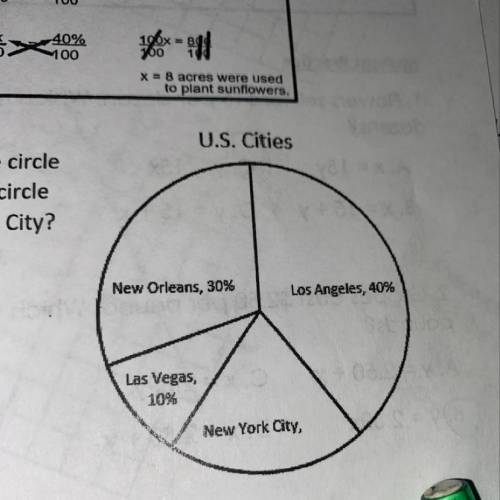
People were asked what U. S. cities they liked to visit. The circle graph displays the responses of 50 people. Based on the circle graph, how many people said they liked to visit New York City?
show explanation please

Answers: 3


Other questions on the subject: Mathematics
Mathematics, 22.06.2019 02:20, traphard979
Find the probability that -0.3203 < = z < = -0.0287 find the probability that -0.5156 < = z < = 1.4215 find the probability that 0.1269 < = z < = 0.6772
Answers: 2
You know the right answer?
People were asked what U. S. cities they liked to visit. The circle graph displays the responses of...
Questions in other subjects:
Mathematics, 22.05.2021 22:20

English, 22.05.2021 22:20


Mathematics, 22.05.2021 22:20
Mathematics, 22.05.2021 22:20


