You are sorting your music by its type. The chart shows how many songs you have for
each type o...

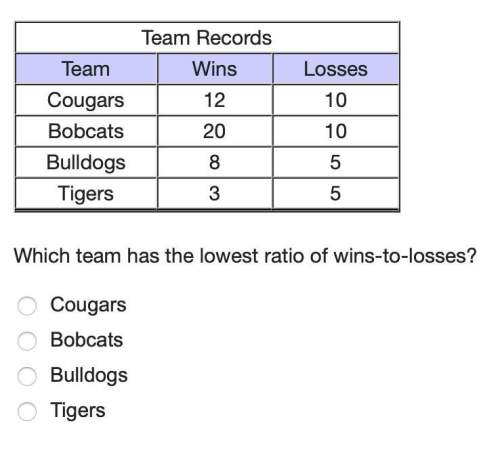
Mathematics, 04.04.2020 01:10 andregijoe41
You are sorting your music by its type. The chart shows how many songs you have for
each type of music. Which bar graph matches your music collection?
Genre
Number of Songs
Classical
12
Pop/Rock
60
Rap/R&B
76
Country
34
Number of Songs
Number of Songs
Number of Songs
62
04
Classkal Pop/Rock Rap/R&B Country
Classical Pop/Rock Rap/R&B County
Classkal Poprock Rap/R&B County

Answers: 2


Other questions on the subject: Mathematics
Mathematics, 21.06.2019 18:50, potato3999
Aresearch group wants to find the opinions’ of city residents on the construction of a new downtown parking garage. what is the population of the survey downtown shoppers downtown visitors downtown workers city residents
Answers: 3
Mathematics, 21.06.2019 20:00, tansebas1107
Can you me find the missing length. i attached an image.
Answers: 1
Mathematics, 22.06.2019 01:40, Anshuman2002
(co 3) the soup produced by a company has a salt level that is normally distributed with a mean of 5.4 grams and a standard deviation of 0.3 grams. the company takes readings of every 10th bar off the production line. the reading points are 5.8, 5.9, 4.9, 6.5, 5.0, 4.9, 6.2, 5.1, 5.7, 6.1. is the process in control or out of control and why? it is out of control as two of these data points are more than 2 standard deviations from the mean it is in control as the data points more than 2 standard deviations from the mean are far apart it is out of control as one of these data points is more than 3 standard deviations from the mean it is in control as the values jump above and below the mean
Answers: 2
You know the right answer?
Questions in other subjects:

Computers and Technology, 14.09.2019 11:10
Computers and Technology, 14.09.2019 11:10

Computers and Technology, 14.09.2019 11:10
Computers and Technology, 14.09.2019 11:10


