
Mathematics, 03.04.2020 08:47 jelopez4
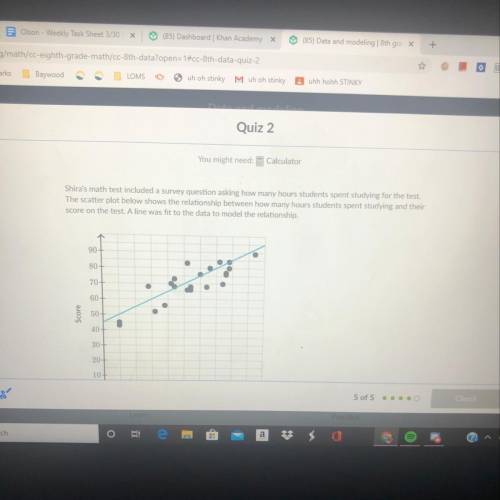
Shira's math test included a survey question asking how many hours students spent studying for the test.
The scatter plot below shows the relationship between how many hours students spent studying and their
score on the test. A line was fit to the data to model the relationship.

Answers: 2


Other questions on the subject: Mathematics
Mathematics, 21.06.2019 18:30, kamiyaharris1
How to use order of operation in 20 divide by 4 multiply 5 = 1
Answers: 1
Mathematics, 21.06.2019 20:10, dashawn3rd55
Over which interval is the graph of f(x) = x2 + 5x + 6 increasing?
Answers: 1
Mathematics, 22.06.2019 00:00, mikemurray115
Triangles abc and dfg are given. find the lengths of all other sides of these triangles if: b ∠a≅∠d, ab·dg=ac·df, ac=7 cm, bc=15 cm, fg=20 cm, and df-ab=3 cm.
Answers: 1
Mathematics, 22.06.2019 00:20, smooth5471
Three students, javier, sam, and corrine, participated in a fundraiser where people donated a certain amount of money per lap that the student ran. each student also had some initial donations that were collected before the run. the equations that represent each student's total donation, y, based on the number of laps ran, x, is shown below. match each equation with the correct rate of change for that student.
Answers: 1
You know the right answer?
Shira's math test included a survey question asking how many hours students spent studying for the t...
Questions in other subjects:
Mathematics, 20.07.2019 05:00

Mathematics, 20.07.2019 05:00
Mathematics, 20.07.2019 05:00

Health, 20.07.2019 05:00

Biology, 20.07.2019 05:00
Mathematics, 20.07.2019 05:00

Social Studies, 20.07.2019 05:00


