
Mathematics, 03.04.2020 04:07 carlo123
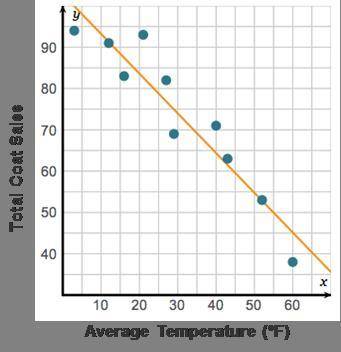
A graph shows average temperature (degrees Fahrenheit) labeled 10 to 60 on the horizontal axis and total coat sales on the vertical axis. A line decreases from 10 to 65.
Which temperature values would an interpolation be limited to?
less than 3
between 3 and 60
between 20 and 80
greater than 55

Answers: 3


Other questions on the subject: Mathematics
Mathematics, 21.06.2019 17:30, laurielaparr2930
X-intercept=-5 y-intercept=2 the equation of the line is
Answers: 2
You know the right answer?
A graph shows average temperature (degrees Fahrenheit) labeled 10 to 60 on the horizontal axis and t...
Questions in other subjects:
Mathematics, 16.10.2020 19:01


History, 16.10.2020 19:01
History, 16.10.2020 19:01
Mathematics, 16.10.2020 19:01
Mathematics, 16.10.2020 19:01
Mathematics, 16.10.2020 19:01
Mathematics, 16.10.2020 19:01


