Which equation could represent the relationship shown in the scatter plot?
y=12x+7
...

Mathematics, 02.04.2020 02:18 shortyyashaun
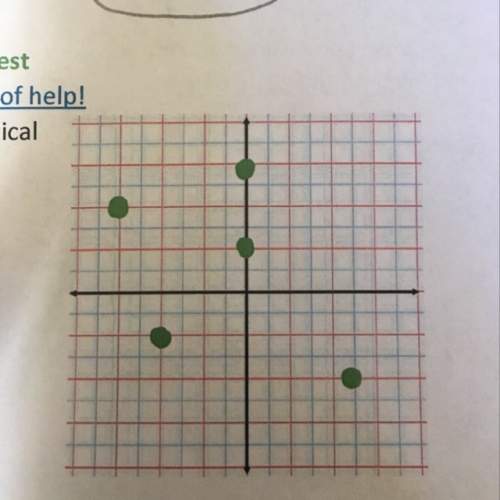
Which equation could represent the relationship shown in the scatter plot?
y=12x+7
y=3x
y=−x+8
y=52x−1
Scatter plot with x axis labeled variable x and y axis labeled variable y. Points go from lower left to upper right.

Answers: 2


Other questions on the subject: Mathematics
Mathematics, 21.06.2019 17:30, hailscooper7363
Simplify this expression.2(10) + 2(x – 4) a. 2x + 16 b. x + 12 c. 2x + 12 d. x + 16
Answers: 2
Mathematics, 21.06.2019 20:30, daniiltemkin20
List x1, x2, x3, x4 where xi is the left endpoint of the four equal intervals used to estimate the area under the curve of f(x) between x = 4 and x = 6. a 4, 4.5, 5, 5.5 b 4.5, 5, 5.5, 6 c 4.25, 4.75, 5.25, 5.75 d 4, 4.2, 5.4, 6
Answers: 1
You know the right answer?
Questions in other subjects:


Chemistry, 03.12.2019 05:31

Social Studies, 03.12.2019 05:31


Chemistry, 03.12.2019 05:31
Mathematics, 03.12.2019 05:31
History, 03.12.2019 05:31


