
Mathematics, 01.04.2020 20:57 NicolasG
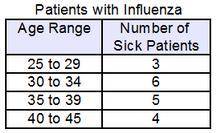
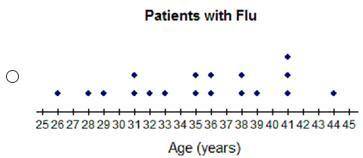
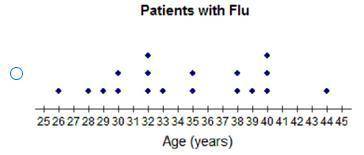
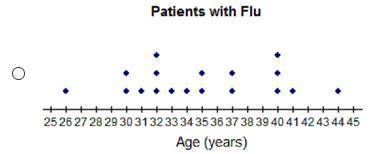
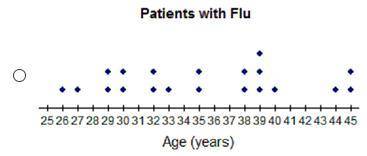
The frequency table shows a set of data collected by a doctor for adult patients who were diagnosed with a strain of influenza.
Which dot plot could represent the same data as the frequency table?

Answers: 2


Other questions on the subject: Mathematics
Mathematics, 21.06.2019 22:00, ashhleyjohnson
After a dreary day of rain, the sun peeks through the clouds and a rainbow forms. you notice the rainbow is the shape of a parabola. the equation for this parabola is y = -x2 + 36. graph of a parabola opening down at the vertex 0 comma 36 crossing the x–axis at negative 6 comma 0 and 6 comma 0. in the distance, an airplane is taking off. as it ascends during take-off, it makes a slanted line that cuts through the rainbow at two points. create a table of at least four values for the function that includes two points of intersection between the airplane and the rainbow. analyze the two functions. answer the following reflection questions in complete sentences. what is the domain and range of the rainbow? explain what the domain and range represent. do all of the values make sense in this situation? why or why not? what are the x- and y-intercepts of the rainbow? explain what each intercept represents. is the linear function you created with your table positive or negative? explain. what are the solutions or solution to the system of equations created? explain what it or they represent. create your own piecewise function with at least two functions. explain, using complete sentences, the steps for graphing the function. graph the function by hand or using a graphing software of your choice (remember to submit the graph).
Answers: 2
Mathematics, 21.06.2019 23:00, britann4256
Calculate the average rate of change over the interval [1, 3] for the following function. f(x)=4(5)^x a. -260 b. 260 c. 240 d. -240
Answers: 1
Mathematics, 21.06.2019 23:40, redhot12352
For a science project, a high school research team conducted a survey of local air temperatures. based on the results of the survey, the found that the average temperatures were around 10 degrees higher than expected. this result was wrong. the trouble with the survey was that most of the locations were exposed to direct sunlight and located over asphalt or sand, which resulted in higher temperatures than normal. this is a classic example of an error in which phase of inferential statistics?
Answers: 1
Mathematics, 22.06.2019 00:00, mikemurray115
Triangles abc and dfg are given. find the lengths of all other sides of these triangles if: b ∠a≅∠d, ab·dg=ac·df, ac=7 cm, bc=15 cm, fg=20 cm, and df-ab=3 cm.
Answers: 1
You know the right answer?
The frequency table shows a set of data collected by a doctor for adult patients who were diagnosed...
Questions in other subjects:
Mathematics, 31.03.2020 17:50


Mathematics, 31.03.2020 17:50
English, 31.03.2020 17:50

Social Studies, 31.03.2020 17:50


