Question 1 of 10
2 Points
Which of the following graphs shows a negative linear relation...

Mathematics, 01.04.2020 17:44 Donlito8070
Question 1 of 10
2 Points
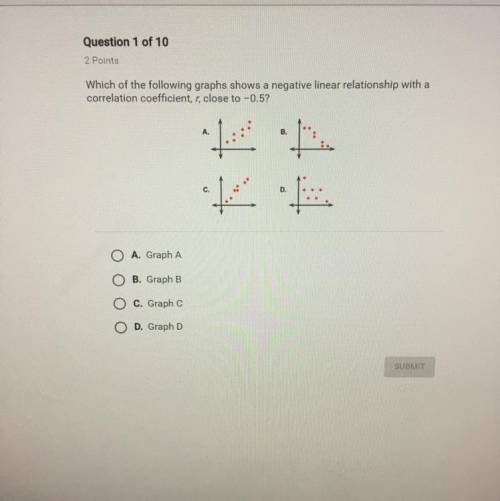
Which of the following graphs shows a negative linear relationship with a
correlation coefficient, r, close to -0.5?
A. Graph A
B. Graph B
C. Graph
D. Graph D

Answers: 1


Other questions on the subject: Mathematics
Mathematics, 21.06.2019 20:30, AllanCasey12
Angles r and s are complementary. the measure of angle r is 31 degrees. which equation can be used to find angle s?
Answers: 1
Mathematics, 22.06.2019 01:30, anaismami1
Travis and paula went to lunch. travis ordered a sandwich for $7.50 and paula ordered a burger for $5.25.after lunch, they left a 15% tip for the waiter. how many money did they spend altogether?
Answers: 3
You know the right answer?
Questions in other subjects:


English, 03.03.2022 22:00


Computers and Technology, 03.03.2022 22:00
English, 03.03.2022 22:00
Computers and Technology, 03.03.2022 22:10


